The Global Financial Centres Index 21 1
The Global
Financial Centres
Index 21
MARCH 2017
Financial Centre Futures 2 The Global Financial Centres Index 21
We are very pleased to present the twenty first edition of the Global
Financial Centres Index (GFCI 21).
In March 2007, Z/Yen released the first edition of the GFCI, which continues to provide evaluations of competitiveness and rankings for the major financial centres around the world.
The China Development Institute (CDI) in Shenzhen and Z/Yen
Partners in London continue their collaboration in producing the GFCI. In September 2015 the two think tanks jointly launched GFCI 18 in Shenzhen and in July 2016 we established a strategic partnership for research into financial centres.
The GFCI is updated every March and September and continues to receive considerable attention from the global financial community.
The index serves as a valuable reference for policy and investment decision-making.
The CDI is a non-governmental think tank that develops solutions to public policy challenges, through broad-scope and in-depth research to help advance China’s reform and opening-up to world markets.
The CDI has been working on the promotion and development of China’s financial system since its establishment 28 years ago. Based on rigorous research and objective analysis, CDI is committed to providing innovative and pragmatic reports for governments at different levels in China and corporations at home and abroad.
The author of this report, Mark Yeandle, would like to thank
Xueyi Jiang, Simon Mills, Ben Morris, Michael Mainelli, Carol Feng,
Peng Yu and the rest of the GFCI team for their contributions with research, modelling and ideas. The Global Financial Centres Index 21 1
Foreword
China’s financial sector is undergoing profound changes which have been accelerating in recent Despite the challenges and uncertainties in the global economy, China remains cool-headed with years. economic globalization. As Chinese President
Xi Jinping put it at Davos 2017, “It is true that economic globalization has created new problems, but this is no justification to write-off economic globalization completely. Rather, we should adapt to and guide economic globalization, cushion its negative impact, and deliver its benefits to all countries and all nations. We should act pro-actively and manage economic globalization as appropriate, so as to release its positive impact and rebalance the process of economic globalization.” These sentiments also apply to China’s financial reform and opening up.
The liberalization of interest rates and the cost of capital, has far-reaching influence on the financial system. In October 2014, China removed the deposit-rate ceiling, marking the last step of interest rate liberalization. The calm reaction of the market showed that market participants were mature and well-prepared.
The fluctuation of the financial markets in 2015 didn’t change China’s commitment to financial reform and opening up. In August 2015, the People's Bank of China (PBOC) announced a major improvement to the formation of the RMB's central parity rate against the US dollar, by taking into consideration the closing rate on the inter-bank forex market of the previous day. Two months later,
RMB was accepted as the fiꢀh component currency of SDR (the Special Drawing Rights by the IMF) following the US Dollar, Euro, Japanese Yen and British Pound. This was widely considered as recognition of China’s financial reform and opening up by the international community.
The next few years will be a critical period for deepening China’s financial reform and opening up.
With the reform of the financial regulatory framework, launch of the registration-based IPO system, evolution of FinTech and the robust growth of the Chinese economy, China will make great progress in its financial reform and opening up.
Shanghai’s position as an international financial centre will be further enhanced.
With the growing size of the Chinese economy, fund-raising in China’s A-share market amounted to
RMB 1.62 trillion in 2016, more than any other market in the world. Since China aims to increase the proportion of direct finance, the potential of the capital market is definitely promising.
Shanghai plays a significant role in China’s financial reform and opening up. As the far-eastern financial centre at the beginning of the 20th Century, Shanghai has now re-emerged as the leading financial centre of China. It hosts almost all financial markets, from stock market to gold, financial derivatives and foreign exchange market. Shanghai has also become China’s first pilot Free Trade Zone. China has made it a national strategy to develop Shanghai into a global financial centre. In 2009, the State
Council announced that it would turn Shanghai into an international financial centre, commensurate with China’s overall economic strength and the international status of RMB. China expects its comprehensive reform to achieve decisive results by 2020. In GFCI 21, Shanghai has risen three places to 13th.
Jiang Jianqing
President of CEIBS Lujiazui Institute of International Finance
Chairman of China-Central Eastern European Fund 2 The Global Financial Centres Index 21
GFCI 21 Summary and Headlines
GLOBAL FINANCIAL CENTRES INDEX 21
The number of financial centres in the main
Western European financial centres are still volatile. Of the 29 GFCI centres in the region, 16 declined and 12 rose.
Geneva recovered some of the ground it lost in GFCI 20. Ratings for Amsterdam,
Vienna and Gibraltar fell significantly. index has increased to 88 with the addition of Guangzhou from the associate centres list. 106 financial centres were researched for this edition of the Global Financial Centres Index
(GFCI).
With the addition of Karachi, Chengdu and Hangzhou the number of associate centres has increased to 18.
The leading financial centres in the Asia/
Pacific region rose in the GFCI ratings.
Beijing rose significantly, rising ten places.
The index was compiled using 101 instrumental factors. These quantitative measures are provided by third parties including the World Bank,
The Economist Intelligence Unit, the OECD and the United Nations. Details can be found in Appendix 4.
Centres in the USA, with the exception of New York, rose in the index. Los Angeles moved up 20 points into the top 20 global centres.
In Canada, Toronto, Montreal and Vancouver all performed well in GFCI 21.
Financial professionals continue to favour safety and stability in their choices of location.
The instrumental factors were combined with financial centre assessments provided by respondents to the GFCI online questionnaire
( We received 3,008 responses to the questionnaire in the 24 months to
December 2016. Details of the methodology behind GFCI 21 can be found in Appendix 3.
Five of the top six Eastern European centres rose in the ratings. Istanbul was the exception to this pattern, falling 11 points. Istanbul is now in 66th place in the GFCI having been 45th a year ago.
Continued conflict and political uncertainty affect confidence in the Turkish capital.
THE RESULTS
Financial centres in the Middle East and Africa did well in GFCI 21. Apart from a very small decline by Dubai, the other main centres improved in the ratings.
There were strong rises for Abu Dhabi and Tel Aviv.
No change in the top five positions.
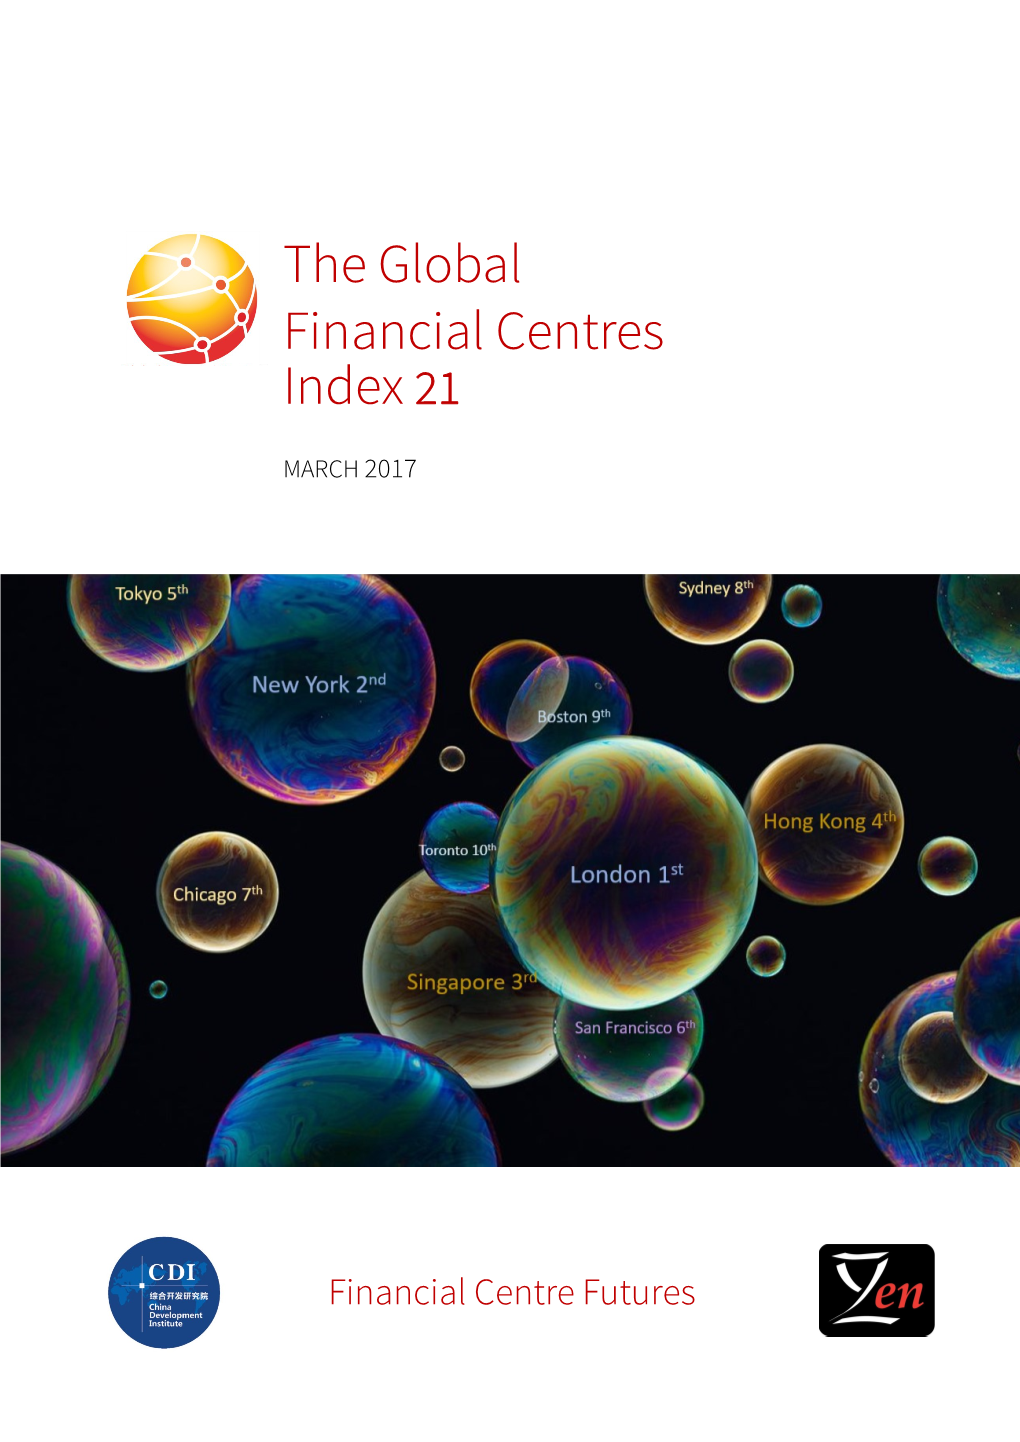
Despite the ‘interesting times’ in which we live, London, New York, Singapore,
Hong Kong and Tokyo remain the top five financial centres.
Brexit and the US election have had a significant impact. London and New
York fell 13 and 14 points respectively.
These were the largest declines (except for Calgary) in the top 50 financial centres.
Latin American centres continue to struggle. Sao Paulo, Rio de Janeiro and Panama all fell significantly. Buenos
Aires and Santiago remain associate centres having failed to accumulate a sufficient number of assessments to enter the main index.
The gap between third place Singapore and second place New York continues to close. Singapore rose by eight points and is now only 20 points behind New
York having been 42 points behind in
GFCI 20. The Global Financial Centres Index 21 3
Offshore centres had mixed results. The British Crown Dependencies remained stable, whilst Caribbean centres had mixed fortunes with the Cayman Islands and the British Virgin Islands falling, but
Bermuda and the Bahamas rising slightly.
Assessments for other European centres fluctuated as people speculated about which centres might benefit from
London leaving the EU.
North American assessments were also more volatile around the time of the USA election, first falling and then rising as the effect of a Trump administration was Political and social upheaval continues to unsettle financial services. The weighed up. volatility of GFCI ratings rose in the second half of 2016. Assessments for
London showed a sharp decline immediately aꢀer the results of the Brexit referendum were known but recovered later in 2016.
The full set of GFCI 21 ranks and ratings are shown in Table 1 overleaf.
Chart 1 | Three Month Rolling Average Assessments for the Top 50 Financial Centres
1000
900
800
700
600
500
400
300
200
100
0
GFCI 2 GFCI 3 GFCI 4 GFCI 5 GFCI 6 GFCI 7 GFCI 8 GFCI 9
GFCI 10 GFCI 11 GFCI 12 GFCI 13 GFCI 14 GFCI 15 GFCI 16 GFCI 17 GFCI 18 GFCI 19 GFCI 20 GFCI 21
“I’m kind of glad I’m this side of the Atlantic and north of the border with the USA right now.”
GLOBAL HEAD OF INVESTMENT BANKING BASED IN TORONTO
“The European finance industry is completely up in the air at the moment .”
COMMERCIAL BANK DIRECTOR BASED IN PARIS 4 The Global Financial Centres Index 21
Table 1 | GFCI 21 Ranks and Ratings
GFCI 21 GFCI 20 CHANGES
Centre
Rank Rank Rating Rank Rating Rating
▲3 8Sydney 721 11 712 ▲9
London 782 01795 ▼13 1
New York 780 02794 ▼14 2
Singapore 760 03752 ▲8 3
Hong Kong 755 04748 ▲7 4
Tokyo 740 5734 ▲6 50
San Francisco 0724 6720 ▲4 6
Chicago 723 8718 ▲5 7▲1
9Boston ▼2 720 7719 ▲1
Toronto 719 710 ▲3 10 13 ▲9
Zurich 718 716 ▼2 11 9▲2
Washington DC 716 713 ▼2 12 ▲3 10
Shanghai 715 700 ▲3 13 16 ▲15
Montreal 713 703 ▲1 14 15 ▲10
Osaka 712 699 ▲2 15 17 ▲13
Beijing 16 710 683 ▲10 26 ▲27
Vancouver 17 709 694 ▲3 20 ▲15
Luxembourg 18 708 711 ▼6 12 ▼3
Los Angeles 19 705 685 ▲6 25 ▲20
Geneva 20 704 689 ▲3 23 ▲15
Melbourne 21 702 687 ▲3 24 ▲15
Frankfurt 23 698 695 ▼4 19 ▲3
Seoul 24 697 704 ▼10 14 ▼7
Dubai 25 696 698 ▼7 18 ▼2
Taipei 26 689 692 ▼5 21 ▼3
Abu Dhabi 28 680 662 ▲4 32 ▲18
Cayman Islands 31 670 676 ▼3 28 ▼6
Tel Aviv 32 666 643 ▲6 38 ▲23
Dublin 33 663 663 ▼2 31 0
Bermuda 34 660 654 ▲1 35 ▲6
Kuala Lumpur 35 659 638 ▲8 43 ▲21
Bangkok 36 656 642 ▲3 39 ▲14
Shenzhen 22 701 691 022 ▲10
Munich 27 682 680 027 ▲2
Paris 29 679 672 029 ▲7
Casablanca 30 674 671 030 ▲3
Qingdao 38 649 ▲8 ▲18 46 631
Doha 39 648 ▲1 ▲7 40 641
Amsterdam 40 647 ▼7 ▼12 33 659
Warsaw 41 645 ▲4 ▲12 45 633
Tallinn 42 640 ▲8 ▲13 50 627
Guangzhou 37 650 ----
Jersey 639 42 43 633 ▼1 ▼6
Oslo 44 632 ▲5 49 628 ▲4
The Global Financial Centres Index 21 5
Table 1 (continued) | GFCI 21 Ranks and Ratings
Centre
GFCI 21 GFCI 20 CHANGES
Rank Rating Rank Rating Rank Rating
631 Riga 45 52 625 ▲7 ▲6
Stockholm 630 46 44 636 ▼2 ▼6
Guernsey 629 47 47 630 0▼1
Liechtenstein 628 48 56 621 ▲8 ▲7
Calgary 627 49 34 658 ▼15 ▼31
Busan 626 50 41 640 ▼9 ▼14
British Virgin Islands 625 51 36 653 ▼15 ▼28
Copenhagen 623 52 60 616 ▲8 ▲7
Glasgow 622 53 61 615 ▲8 ▲7
Edinburgh 621 54 66 610 ▲12 ▲11
Brussels 620 55 62 614 ▲7 ▲5
Milan 619 56 53 624 ▼3 ▼5
Bahrain 618 57 58 619 ▲1 ▼1
Isle of Man 617 58 65 611 ▲7 ▲6
Johannesburg 616 59 59 618 0▼2
Trinidad Tobago 615 60 71 604 ▲11 ▲11
Mexico City 614 61 73 600 ▲12 ▲14
Sao Paulo 613 62 51 626 ▼11 ▼13
Mumbai 612 63 75 598 ▲12 ▲14
Vienna 611 64 37 645 ▼27 ▼34
Manila 610 65 78 595 ▲13 ▲15
Istanbul 609 66 57 620 ▼9 ▼11
Jakarta 608 67 76 597 ▲9 ▲11
Madrid 607 68 68 608 0▼1
Prague 606 69 72 603 ▲3 ▲3
Budapest 604 70 77 596 ▲7 ▲8
Mauritius 603 71 79 594 ▲8 ▲9
Rome 601 72 64 612 ▼8 ▼11
Rio de Janeiro 599 73 54 623 ▼19 ▼24
Monaco 598 74 67 609 ▼7 ▼11
Dalian 597 75 48 629 ▼27 ▼32
Riyadh 596 76 82 585 ▲6 ▲11
Malta 594 77 74 599 ▼3 ▼5
Lisbon 593 78 69 607 ▼9 ▼14
Cyprus 590 79 80 593 ▲1 ▼3
Almaty 589 80 70 605 ▼10 ▼16
Gibraltar 587 81 55 622 ▼26 ▼35
Helsinki 585 82 81 586 ▼1 ▼1
Bahamas 582 83 86 566 ▲3 ▲16
Panama 580 84 63 613 ▼21 ▼33
Moscow 566 85 84 568 ▼1 ▼2
St Petersburg 565 86 85 567 ▼2 ▼1
Reykjavik 550 87 83 573 ▼23 ▼4
Athens 522 88 87 535 ▼13 ▼1
6 The Global Financial Centres Index 21
Table 2 lists ‘Associate Centres’ which are included within the GFCI questionnaire but have yet to acquire the number of assessments necessary to be included within the GFCI.
Table 2 | Associate Centres
Number of Assessments in the last 24
months
Centre Mean of Assessments
New Delhi 116 515
Tianjin 113 638
Hamburg 102 600
Baku 97 505
Buenos Aires 87 511
Kuwait City 85 568
Barbados 74 507
Wellington 69 680
Santiago 69 625
Nairobi 69 494
Sofia 69 561
Cape Town 69 603
Bratislava 53 536
GIFT (Gujarat) 30 620
Tehran 23 452
Karachi 17 500
Chengdu --
Hangzhou --
Astana --
Chart 2 shows the average rating of the top five centres in each region. This demonstrates that the historical dominance of the leading centres in
Western Europe and North America has been eroded over time. The average assessment of the top five financial centres in the Asia/Pacific region is now ahead of the comparable figure for Western
Europe and North America. The top centres in other regions, especially in Latin America and Eastern Europe and Central Asia are also closing the gap on the leaders.
Chart 2 | The Mean Rating of the Top Five Centres in Each Region
775
725
675
625
575
525
475
425
375
Western Europe
Asia/Pacific
Asia / Pacific
North America
North America
Western Europe
Eastern Europe and Central Asia
Middle East Africa
Middle East and Africa
Latin America the Caribbean
Latin America and the Caribbean
Eastern Europe and Central Asia The Global Financial Centres Index 21 7
Chart 3 shows the performance over time of the top five financial centres. London and New York behind New York. have suffered declines in the ratings in GFCI 21.
Singapore, in third place is now only 20 points Chart 3 | The Top Five Centres - GFCI Ratings Over Time
850
London and New York trend line
800
750
700
650
600
London
New York
London
New York
Singapore and Hong Kong trend line
Singapore
Singapore
Hong Kong
Hong Kong
Tokyo
Tokyo
The GFCI questionnaire asks respondents which centres they consider likely to become more significant in the next few years.
Table 3 shows the top 15 centres mentioned. Five of the top six centres are Asian.
Table 3 | The 15 Centres Likely to Become More Significant
Centre Mentions in last 24 months
Shanghai 119
Singapore 94
Dubai 78
Hong Kong 68
Qingdao 57
Shenzhen 55
Casablanca 38
Dublin 33
Luxembourg 31
Toronto 30
Gibraltar 24
Beijing 23
Busan 21
Istanbul 12
Abu Dhabi 12 8 The Global Financial Centres Index 21
Areas of Competitiveness
The instrumental factors used in the GFCI model are grouped into five broad factors of Business Environment, Human Capital,
Infrastructure, Financial Sector Development competitiveness: and Reputation.
Chart 4 | GFCI 21 Areas of Competitiveness
Areas of competitiveness
Business
Human Sector infrastructure Reputation environment capital development
Depth / breadth of industry clusters
and rule of law and appeal skilled personnel
Political stability Availability of City brand
Built
infrastructure
Institutional and regulatory
ICT
Flexible labour Availability of Level of infrastructure market capital innovation environment
Attractiveness and cultural diversity
Macroeconomic Education and environment development
Transport
Market liquidity infrastructure
Comparative other centres
Tax and cost
Quality of life positioning with Economic output
Sustainability
competitiveness
To assess how financial centres perform in each of these areas, the GFCI 21 factor assessment model is run with only one of the five groups of areas of competitiveness at a time. The top 15 ranked centres in each sub-index are shown in Table 4.
Table 4 | GFCI 21 Areas of Competitiveness
Financial Sector
Development
Rank Business Environment Human Capital Infrastructure Reputation
1London (-) New York (-) London (-) London (-) New York (+1)
2New York (-) London (-) New York (-) New York (-) London (-1)
3Hong Kong (-) Hong Kong (+1) Hong Kong (-) Hong Kong (+1) Singapore (-)
4Singapore (-1) Singapore (-) Singapore (-) Singapore (-1) Hong Kong (-)
5Toronto (+3) Tokyo (-) Tokyo (-) Boston (-) Chicago (-)
6Tokyo (-1) Chicago (+1) Shanghai (+3) Tokyo (+1) Boston (-)
7Beijing (+9) Chicago (-1) Los Angeles (-1) San Francisco (-) Tokyo (+7)
San Francisco (-2) Los Angeles (-1) 8San Francisco (-1) Chicago (-) Sydney (+2)
9Montreal (+3) Boston (+1) Taipei (+5) Washington DC (+1) San Francisco (-2)
Dubai (+3) Shanghai (+4) 10 Sydney (-) Shanghai (+18) Zurich (+4)
Boston (-1) 11 Zurich (-1) Washington DC (-1) Boston (-4) Washington DC (-3)
Frankfurt (-) Washington DC (-3) Luxembourg (+3) 12 Shenzhen (+7) Toronto (-)
Zurich (-4) 13 Zurich (-2) Paris (+5) Los Angeles (-2) Dublin (+15)
Sydney (-4) Luxembourg (-1) San Francisco (-1) 14 Toronto (+1) Los Angeles (-6)
Zurich (-3) Toronto (+1) Washington DC (-1) 15 Edinburgh (+4) Shanghai (-3)
The Global Financial Centres Index 21 9
The top financial centres of the world are well developed and sophisticated. The top five financial centres feature in the top seven centres in all the sub-indices. they consider the most important at the moment. The number of times that each area is mentioned is shown in Table 5 below.
The GFCI questionnaire asks respondents to indicate which factors of competitiveness
Table 5 | GFCI 21 Main Areas of Competitiveness
Main Issues
Area of Competitiveness Number of Mentions
Brexit is a major source of uncertainty for all centres - not just London
Business Environment 645 Corruption and the rule of law remain major factors
Protectionism and barriers to international trade are beginnning to worry many
Terrorism, personal safety and human rights are becoming ever more important
UK and USA respondents fear restrictions in movement of talented staff
A crack-down on tax avoidance (through domicile arbitrage) is important
A need for greater harmonisation of tax laws internationally
More promotion of centres is needed for differentiation
Human Capital 583
Taxation 522
Reputation 518
A reputation as a good and safe place to live grows in importance
ICT links and FinTech advances are hot topics now
Infrastructure 503
Great need for increase air travel connectivity in some financial centres
Will London lose its critical mass after Brexit?
Financial Sector Development 498
Fear of clustering being threatened by protectionism
“This new ‘protectionism’ cannot be a good thing in the long run - for financial services or any other sector.”
INVESTMENT BANKER BASED IN CHICAGO
“I think FinTech is likely to be even more disruptive than Brexit over the next five years.”
INSURANCE EXECUTIVE BASED IN LONDON 10 The Global Financial Centres Index 21
Competitiveness and Corruption
Our research into the competitiveness of financial centres indicates that the level of corruption in a financial centre is becoming ever more important. Charts 5 and 6 use two GDP. instrumental factors that relate specifically to corruption, to demonstrate the close correlation with the GFCI 21 rating. The size of the bubbles is a relative indication of a financial centre’s
Chart 5 | GFCI 21 Rating against Corruption Perceptions Index (Supplied by Transparency International)
Western Europe
New York
Asia / Pacific
North America
London
Eastern Europe and Central Asia
Middle East and Africa
Latin America and the Caribbean
Hong Kong
Tokyo
Singapore
Decreasing Corruption Perceptions
Chart 6 | GFCI 21 Rating against Increasing Control of Corruption (Supplied by the World Bank)
Western Europe
Asia / Pacific
New York
London
North America
Eastern Europe and Central Asia
Middle East and Africa
Latin America and the Caribbean
Hong Kong
Tokyo
Singapore
Increasing Control of Corruption The Global Financial Centres Index 21 11
Connectivity
One of the most important benefits of hosting a thriving financial centres is the extent to which that centre is connected to other financial centres. One way of measuring this assessments given to and received from, other financial centres. Charts 7 and 8 use New York and Chicago as examples to contrast the different levels of connectivity that the two connectivity is to look at the number of centres enjoy.
Chart 7 | GFCI 21 Connectivity - New York
Western Europe
Asia / Pacific
North America
Eastern Europe and Central Asia
Middle East and Africa
Latin America and the Caribbean
10 – 39 ratings
40 – 59 ratings
60 – 79 ratings
80 – 99 ratings
Over 100 ratings
Chart 8 | GFCI 21 Connectivity - Chicago
Western Europe
Asia / Pacific
North America
Eastern Europe and Central Asia
Middle East and Africa
Latin America and the Caribbean
10 – 39 ratings
40 – 59 ratings
60 – 79 ratings
80 – 99 ratings
Over 100 ratings 12 The Global Financial Centres Index 21
Financial Centre Profiles
Using clustering and correlation analysis we have identified three measures (axes) that determine a financial centre’s profile along different dimensions of competitiveness.
In Table 6 ‘Diversity’ (Breadth) and ‘Speciality’ (Depth) are combined on one axis to create a two dimensional table of financial centre profiles. The 88 centres in GFCI 21 are assigned a profile on the basis of a set of rules for the three measures: how well connected a centre is, how broad its services are and how specialised it is.
Chart 9 | GFCI 21 Profile Elements
The 14 Global Leaders (in the top leꢀ of the table) have both broad and deep financial services activities and are connected with many other financial centres. This list includes the top five global financial centres. Other leading centres are profiled as Established
International Centres.
Significant changes in GFCI 21 include Dubai,
Washington and Beijing becoming Global
The Global Financial Centres Index 21