Online Resource 3
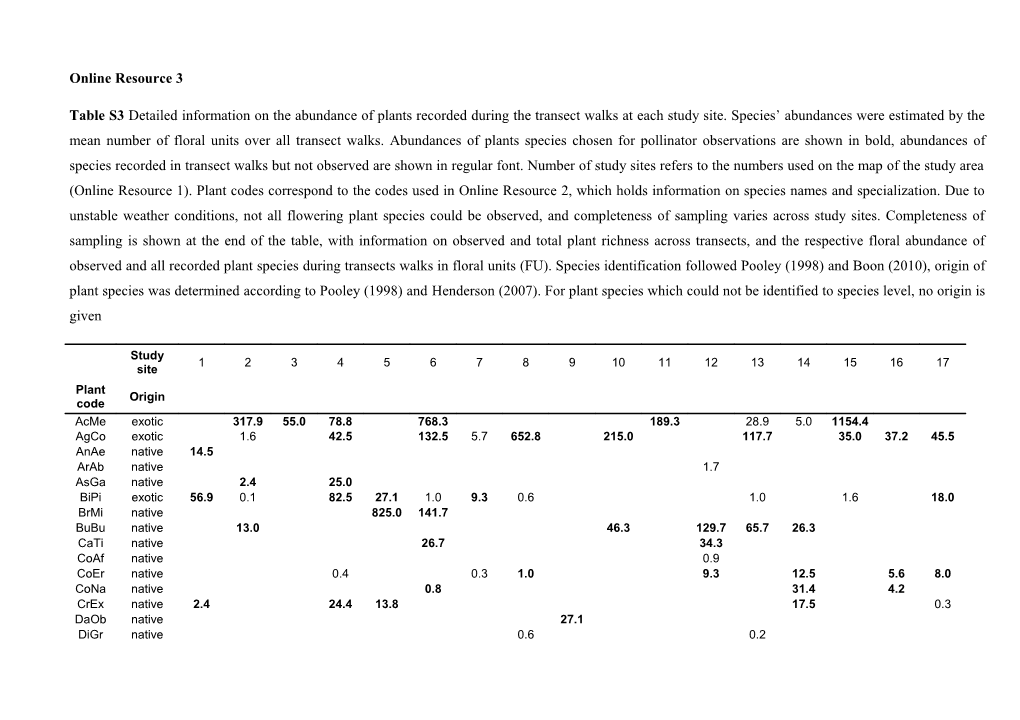
Table S3 Detailed information on the abundance of plants recorded during the transect walks at each study site. Species’ abundances were estimated by the mean number of floral units over all transect walks. Abundances of plants species chosen for pollinator observations are shown in bold, abundances of species recorded in transect walks but not observed are shown in regular font. Number of study sites refers to the numbers used on the map of the study area (Online Resource 1). Plant codes correspond to the codes used in Online Resource 2, which holds information on species names and specialization. Due to unstable weather conditions, not all flowering plant species could be observed, and completeness of sampling varies across study sites. Completeness of sampling is shown at the end of the table, with information on observed and total plant richness across transects, and the respective floral abundance of observed and all recorded plant species during transects walks in floral units (FU). Species identification followed Pooley (1998) and Boon (2010), origin of plant species was determined according to Pooley (1998) and Henderson (2007). For plant species which could not be identified to species level, no origin is given
Study site / 1 / 2 / 3 / 4 / 5 / 6 / 7 / 8 / 9 / 10 / 11 / 12 / 13 / 14 / 15 / 16 / 17Plant code / Origin
AcMe / exotic / 317.9 / 55.0 / 78.8 / 768.3 / 189.3 / 28.9 / 5.0 / 1154.4
AgCo / exotic / 1.6 / 42.5 / 132.5 / 5.7 / 652.8 / 215.0 / 117.7 / 35.0 / 37.2 / 45.5
AnAe / native / 14.5
ArAb / native / 1.7
AsGa / native / 2.4 / 25.0
BiPi / exotic / 56.9 / 0.1 / 82.5 / 27.1 / 1.0 / 9.3 / 0.6 / 1.0 / 1.6 / 18.0
BrMi / native / 825.0 / 141.7
BuBu / native / 13.0 / 46.3 / 129.7 / 65.7 / 26.3
CaTi / native / 26.7 / 34.3
CoAf / native / 0.9
CoEr / native / 0.4 / 0.3 / 1.0 / 9.3 / 12.5 / 5.6 / 8.0
CoNa / native / 0.8 / 31.4 / 4.2
CrEx / native / 2.4 / 24.4 / 13.8 / 17.5 / 0.3
DaOb / native / 27.1
DiGr / native / 0.6 / 0.2
EkPt / native / 194.3
ErPi / native / 5.7
EuCh / native / 15.5
GaPa / exotic / 99.0
Ge sp / NA / 5.0
GoPh / native / 17.9 / 4.3
GrOc / native / 9.9
GyHe / native / 37.9
HaLu / native / 8.8 / 268.8 / 62.2
HeCe / native / 6.1
HeRu / native / 41.9 / 1325.6 / 2.9 / 5.6 / 35.8 / 128.9 / 386.3
HeSp / native / 2.1 / 173.0 / 995.6 / 17.5 / 498.3 / 38.0 / 1385.0 / 137.8 / 347.5 / 298.3 / 326.7
HyAn / native / 8.1
Hy sp / NA / 68.5
IpCa / native / 0.8 / 3.9
KeGu / native / 43.4 / 167.0 / 39.1 / 227.5
LaCa / exotic / 4.0 / 12.9 / 64.3 / 1348.8 / 78.8 / 417.7 / 49.0 / 287.1 / 129.4 / 22.8 / 22.8 / 476.7 / 75.0
LoAn / native / 1.0
LuOc / native / 8.6
MaLa / native / 393.8 / 14.3 / 1.1
MiMe / native / 8.0 / 15.0 / 8.6
MoSt / native / 5.6
MoUn / native / 5.0
NeCa / native / 5.0
OlHe / native / 24.3
OpSt / exotic / 1.5
OxCo / exotic / 77.1
PeAl / native / 13.8
PiVi / native / 184.3
Pl sp / exotic / 1.3
PoPu / native / 7.4
PsCa / native / 16.4 / 666.9 / 5.4
RiBr / exotic / 19.4
RuCu / exotic / 38.7 / 8.1 / 0.8 / 64.4
SeBi / exotic / 83.6
SeDe / native / 12.0
SelDen / native / 111.1 / 65.0
SeMa / native / 96.9 / 31.0 / 12.3 / 1755.6 / 651.9 / 86.3 / 7.7 / 43.5 / 9.3 / 21.8 / 0.3 / 2.0
SePo / native / 18.7 / 291.3 / 392.5 / 587.8 / 859.0 / 264.6 / 75.6 / 21.3
SePy / native / 27.1 / 125.0
SiCo / native / 0.6 / 0.6 / 7.1 / 2.1 / 1.3
SoMa / exotic / 8.6 / 33.7 / 1.6
So sp / NA / 0.3
StAe / native / 23.4 / 4.0
StPo / native / 11.1
SyCo / native / 0.8 / 2.8 / 235.6
TeGr / native / 78.7 / 1.9
ThAl / native / 3.0
ThDr / native / 5.0
TrDi / native / 0.6 / 1.1
TrOr / native / 13.0
VeAr / exotic / 19.4
VeBo / exotic / 114.5
VeBr / exotic / 6.6
ZaAe / native / 0.4
Plant richness observed / 7 / 7 / 6 / 11 / 14 / 9 / 7 / 9 / 7 / 5 / 4 / 8 / 12 / 11 / 11 / 8 / 11
Plant richness in transect / 10 / 10 / 6 / 14 / 17 / 10 / 9 / 12 / 8 / 5 / 4 / 11 / 19 / 13 / 13 / 13 / 16
Sampling completeness [%] / 70 / 70 / 100 / 79 / 82 / 90 / 78 / 75 / 88 / 100 / 100 / 73 / 63 / 85 / 85 / 62 / 69
∑(FU of observed plants) / 659.3 / 765.6 / 1520.4 / 4690.1 / 5122.0 / 2222.3 / 1107.6 / 874.5 / 352.9 / 1313.1 / 1870.7 / 226.9 / 1205.1 / 1561.0 / 4550.7 / 966.1 / 1401.5
∑(FU all plants in transects) / 660.9 / 769.4 / 1520.4 / 4699.9 / 5391.9 / 2223.3 / 1113.6 / 889.5 / 369.3 / 1313.1 / 1870.7 / 243.7 / 1381.7 / 1616.6 / 4569.3 / 1159.9 / 1427.4
Sampling completeness [%] [%] / 100 / 99 / 100 / 100 / 95 / 100 / 99 / 98 / 96 / 100 / 100 / 93 / 87 / 97 / 100 / 83 / 98