SELECTED POPULATION DEMOGRAPHICS
JEFFERSON COUNTY, TX
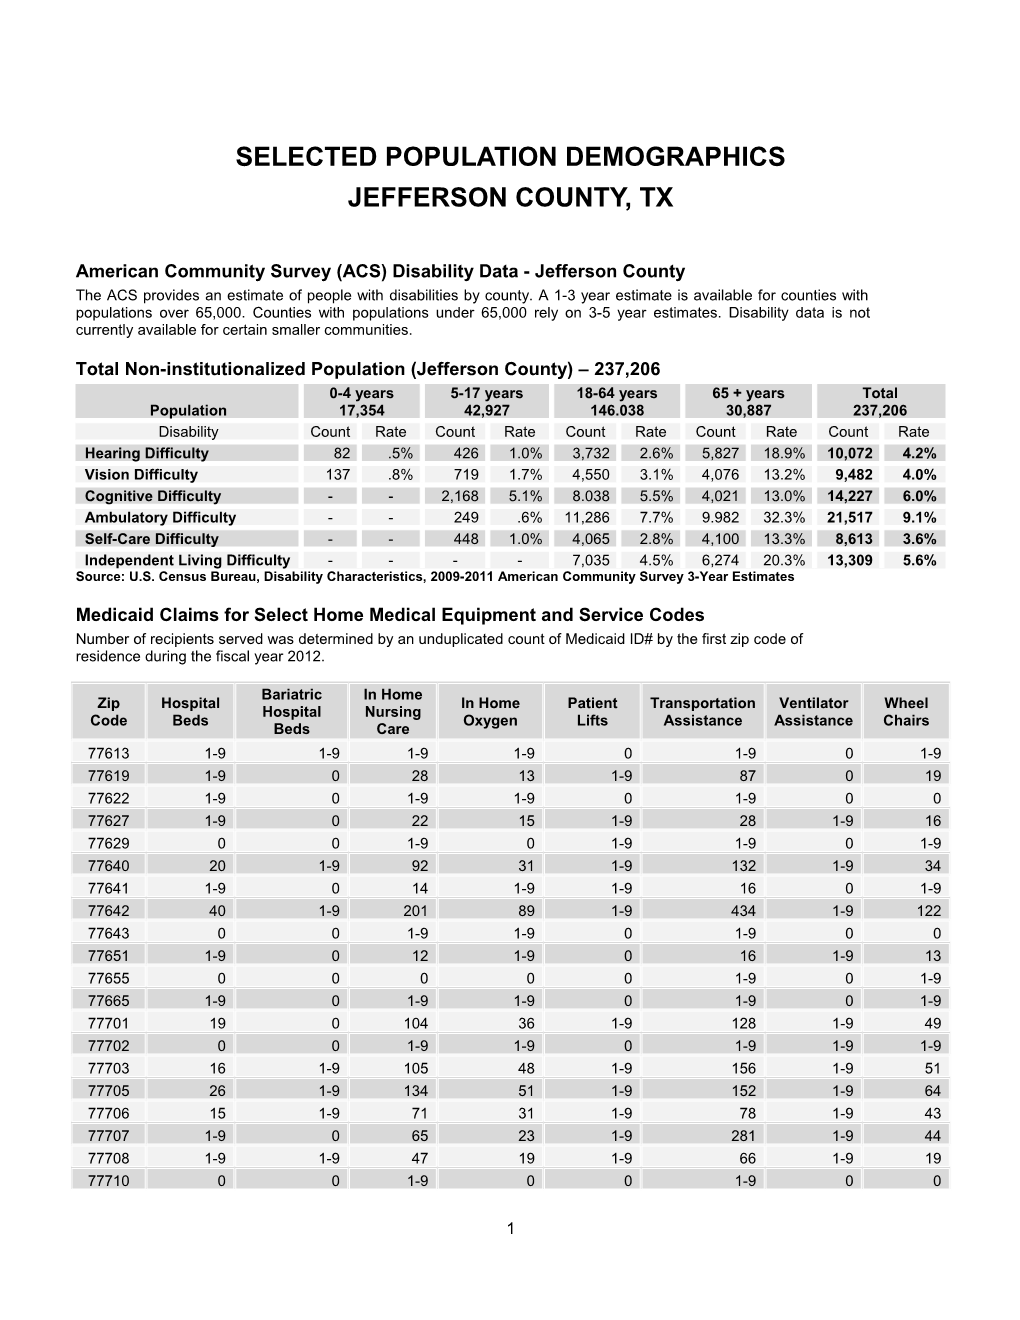
American Community Survey (ACS) Disability Data - Jefferson County
The ACS provides an estimate of people with disabilities by county. A 1-3 year estimate is available for counties with populations over 65,000. Counties with populations under 65,000 rely on 3-5 year estimates. Disability data is not currently available for certain smaller communities.
Total Non-institutionalized Population (Jefferson County) – 237,206
Population / 0-4 years17,354 / 5-17 years
42,927 / 18-64 years
146.038 / 65 + years
30,887 / Total
237,206
Disability / Count / Rate / Count / Rate / Count / Rate / Count / Rate / Count / Rate
Hearing Difficulty / 82 / .5% / 426 / 1.0% / 3,732 / 2.6% / 5,827 / 18.9% / 10,072 / 4.2%
Vision Difficulty / 137 / .8% / 719 / 1.7% / 4,550 / 3.1% / 4,076 / 13.2% / 9,482 / 4.0%
Cognitive Difficulty / - / - / 2,168 / 5.1% / 8.038 / 5.5% / 4,021 / 13.0% / 14,227 / 6.0%
Ambulatory Difficulty / - / - / 249 / .6% / 11,286 / 7.7% / 9.982 / 32.3% / 21,517 / 9.1%
Self-Care Difficulty / - / - / 448 / 1.0% / 4,065 / 2.8% / 4,100 / 13.3% / 8,613 / 3.6%
Independent Living Difficulty / - / - / - / - / 7,035 / 4.5% / 6,274 / 20.3% / 13,309 / 5.6%
Source: U.S. Census Bureau, Disability Characteristics, 2009-2011 American Community Survey 3-Year Estimates
Medicaid Claims for Select Home Medical Equipment and Service Codes
Number of recipients served was determined by an unduplicated count of Medicaid ID# by the first zip code of residence during the fiscal year 2012.
Zip Code / Hospital Beds / Bariatric Hospital Beds / In Home Nursing Care / In Home Oxygen / Patient Lifts / Transportation Assistance / Ventilator Assistance / Wheel Chairs /77613 / 1-9 / 1-9 / 1-9 / 1-9 / 0 / 1-9 / 0 / 1-9
77619 / 1-9 / 0 / 28 / 13 / 1-9 / 87 / 0 / 19
77622 / 1-9 / 0 / 1-9 / 1-9 / 0 / 1-9 / 0 / 0
77627 / 1-9 / 0 / 22 / 15 / 1-9 / 28 / 1-9 / 16
77629 / 0 / 0 / 1-9 / 0 / 1-9 / 1-9 / 0 / 1-9
77640 / 20 / 1-9 / 92 / 31 / 1-9 / 132 / 1-9 / 34
77641 / 1-9 / 0 / 14 / 1-9 / 1-9 / 16 / 0 / 1-9
77642 / 40 / 1-9 / 201 / 89 / 1-9 / 434 / 1-9 / 122
77643 / 0 / 0 / 1-9 / 1-9 / 0 / 1-9 / 0 / 0
77651 / 1-9 / 0 / 12 / 1-9 / 0 / 16 / 1-9 / 13
77655 / 0 / 0 / 0 / 0 / 0 / 1-9 / 0 / 1-9
77665 / 1-9 / 0 / 1-9 / 1-9 / 0 / 1-9 / 0 / 1-9
77701 / 19 / 0 / 104 / 36 / 1-9 / 128 / 1-9 / 49
77702 / 0 / 0 / 1-9 / 1-9 / 0 / 1-9 / 1-9 / 1-9
77703 / 16 / 1-9 / 105 / 48 / 1-9 / 156 / 1-9 / 51
77705 / 26 / 1-9 / 134 / 51 / 1-9 / 152 / 1-9 / 64
77706 / 15 / 1-9 / 71 / 31 / 1-9 / 78 / 1-9 / 43
77707 / 1-9 / 0 / 65 / 23 / 1-9 / 281 / 1-9 / 44
77708 / 1-9 / 1-9 / 47 / 19 / 1-9 / 66 / 1-9 / 19
77710 / 0 / 0 / 1-9 / 0 / 0 / 1-9 / 0 / 0
77713 / 1-9 / 1-9 / 25 / 11 / 1-9 / 25 / 1-9 / 16
77720 / 0 / 0 / 1-9 / 1-9 / 0 / 1-9 / 0 / 1-9
77725 / 0 / 0 / 1-9 / 1-9 / 0 / 1-9 / 1-9 / 1-9
77726 / 1-9 / 0 / 1-9 / 1-9 / 0 / 11 / 1-9 / 1-9
Prepared By: Strategic Decision Support, Texas Health and Human Services Commission, January 2012
Total Population by Zip Code
Based on the 2010 U.S. Census. This is the most current data for overall populations by zip code at this time.
Zip Code / <5 Years / 5-19 Years / 20-64 Years / 65-84 Years / >84 Years / Total77613 / 74 / 223 / 745 / 161 / 15 / 1218
77619 / 1076 / 3117 / 9437 / 2106 / 411 / 16147
77622 / 79 / 279 / 851 / 164 / 17 / 1390
77627 / 1305 / 4219 / 12794 / 2813 / 323 / 21454
77629 / 47 / 182 / 539 / 101 / 8 / 877
77640 / 1155 / 3348 / 9530 / 2502 / 340 / 16875
77642 / 3200 / 8486 / 21138 / 3546 / 741 / 37111
77651 / 780 / 2594 / 7634 / 1801 / 234 / 13043
77655 / 22 / 52 / 221 / 57 / 4 / 356
77701 / 1154 / 3296 / 8417 / 1557 / 250 / 14674
77702 / 218 / 522 / 1877 / 251 / 25 / 2893
77703 / 1413 / 3627 / 8468 / 1282 / 216 / 15006
77705 / 1804 / 7292 / 28062 / 2951 / 366 / 40475
77706 / 1700 / 4928 / 17113 / 3699 / 818 / 28258
77707 / 1259 / 4004 / 9387 / 2078 / 352 / 17080
77708 / 991 / 2594 / 6749 / 1051 / 133 / 11518
77713 / 810 / 2410 / 8065 / 1375 / 128 / 12788
77808 / 696 / 2366 / 6401 / 1057 / 114 / 10634
Source: U.S. Census Bureau, Zip Code Tabulation Area Fact Sheet
2