Raj Shah
GIS in Water Resources Fall 2017
Term Project Update
Flood Damage Vulnerability Assessment: a Case Study on Virginia Beach
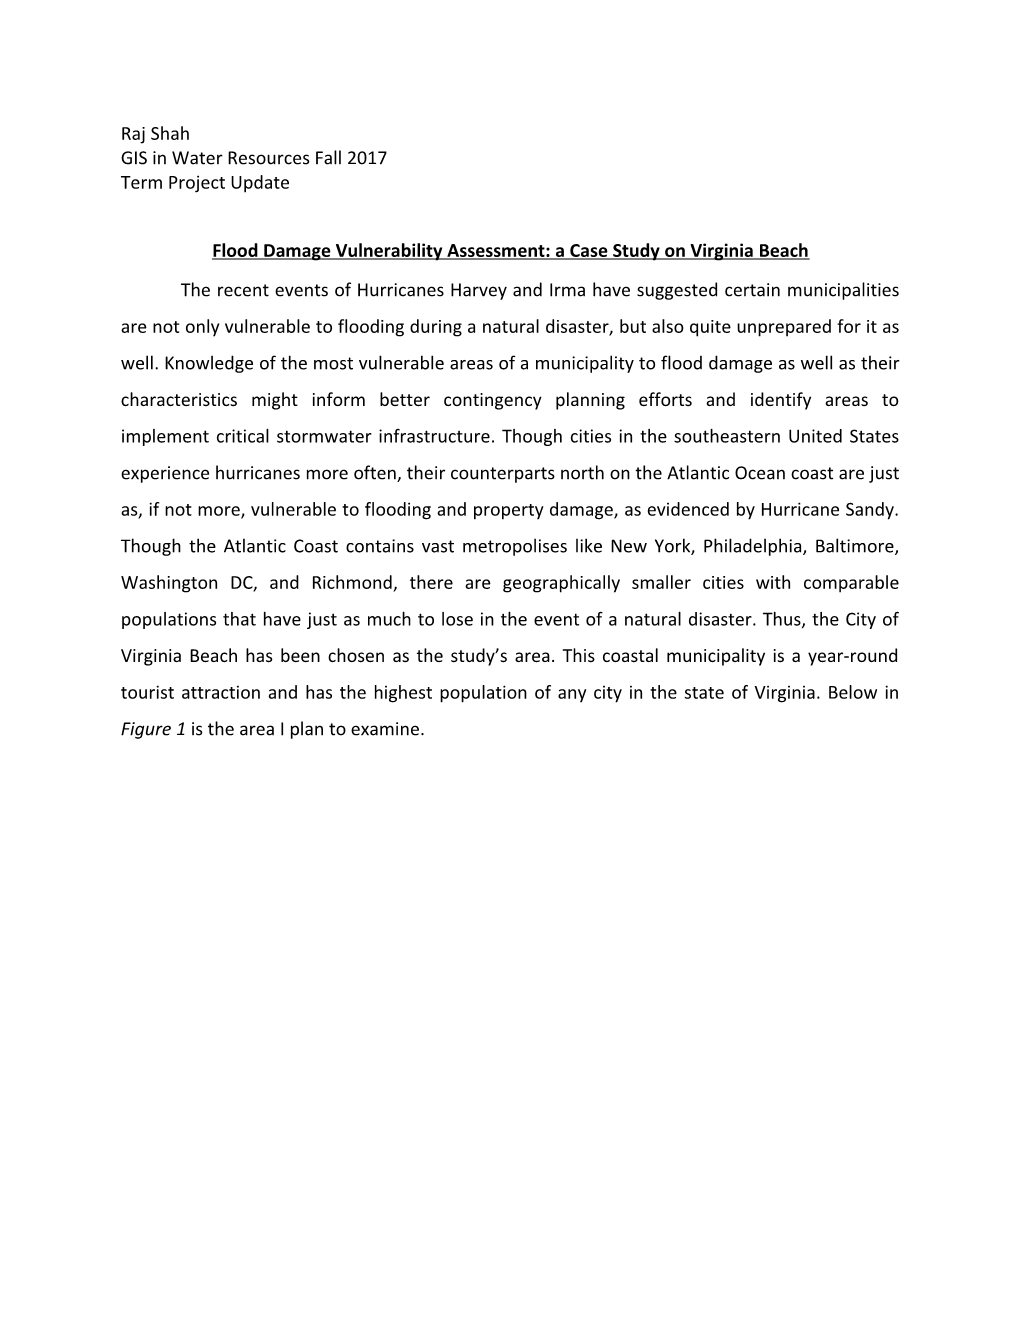
The recent events of Hurricanes Harvey and Irma have suggested certain municipalities are not only vulnerable to flooding during a natural disaster, but also quite unprepared for it as well. Knowledge of the most vulnerable areas of a municipality to flood damage as well as their characteristics might inform better contingency planning efforts and identify areas to implement critical stormwater infrastructure. Though cities in the southeastern United States experience hurricanes more often, their counterparts north on the Atlantic Ocean coast are just as, if not more, vulnerable to flooding and property damage, as evidenced by Hurricane Sandy. Though the Atlantic Coast contains vast metropolises like New York, Philadelphia, Baltimore, Washington DC, and Richmond, there are geographically smaller cities with comparable populations that have just as much to lose in the event of a natural disaster. Thus, the City of Virginia Beach has been chosen as the study’s area. This coastal municipality is a year-round tourist attraction and has the highest population of any city in the state of Virginia. Below in Figure 1 is the area I plan to examine.
Figure 1, City of Virginia Beach: Study Area- from City of Virginia Beach, Virginia DOT, Virginia GIN
The study area boundary data was obtained from the City of Virginia Beach, while the Annual Average Daily Traffic measures (AADT) and road centerline data were obtained from the Virginia Department of Transportation (VDOT) and the Virginia Geographic Information Network (VGIN) respectively. This study will also examine stream data from the National Hydrography Dataset, elevation data from the USGS National Elevation Dataset, and population data from the 2015 American Community Survey 5-Year data. The reason NHDPlus and DEMs are not included in this map is that downloads from the USGS website were temporarily disabled at the time Figure 1 was created. The datasets have since been downloaded. At this stage, I have collected all the data necessary to perform this analysis.
Going forward, I will first ensure that all datasets are either applicable or clipped to the boundary of the City of Virginia Beach. I will then visually observe the correlations between mean annual flow of streams and other variables including population density, annual average daily traffic, and elevation. For stream, AADT, and population density, data will be converted to raster data, such that the Reclassify tool can then be used to indicate the degree to which these variables change. A “reverse suitability analysis” will then be performed, using the Raster Calculator tool to identify areas of greatest concern for flood damage, based on weights assigned to these variables. At this time, I have chosen weights of 30% for elevation and mean annual average flow of streams, 25% for AADT, and 15% for population density. This weighting is based on understanding of which variables affect flood risk and to what extent, but may be changed upon examination of past literature on similar analyses. I estimate that these remaining tasks will be completed sometime over the next two weeks. Ultimately, the output of this project might be useful to identify areas of Virginia Beach to include in any future disaster planning efforts or where to implement stormwater infrastructure measures.