Keeping children at school—factors affecting attendance and children’s academic achievement
School attendance and Year 12 completion rates are much lower for Indigenous children than for non-Indigenous children and decreasing this disparity is a priority of the Council of Australian Governments (COAG)’s Closing the Gap agenda.
Analysis of the data from the Longitudinal Study of Australian Youth (LSAY) has shown that parental aspirations influence children’s educational and occupational aspirations. Gemici et al. (cited in Nguyen & Blomberg 2014) note that students whose parents aspire for them to attend university are four times more likely to complete Year 12 and eleven times more likely to attend university compared with those whose parents expect them to choose non-university pathways. While the LSAY research examines educational aspirations and outcomes of children who are in secondary school, children’s attitudes and values are being influenced by their parents from a much earlier age (Changing Minds 2014).
As discussed in the Wave 3 report in this series (FaHCSIA 2012), primary carers in Footprints in Time consider their child’s education to be important and many expressed hope that their children will go further in their education than they did themselves. While only about one-third of primary carers in the Footprints in Time study had completed Year 12, and less than 10 per cent had a university qualification in 2012, an overwhelming majority said that they expected their child to at least finish secondary school. One in three hoped the child would get a university degree.
In Wave 3 primary carers of the older cohort were asked whether they had liked school as a child. Of those asked, 88.5 per cent said that they liked primary school a lot or a bit. Interestingly, parents who disliked primary school were just as likely to attain a higher qualification or degree as parents who had liked primary school.
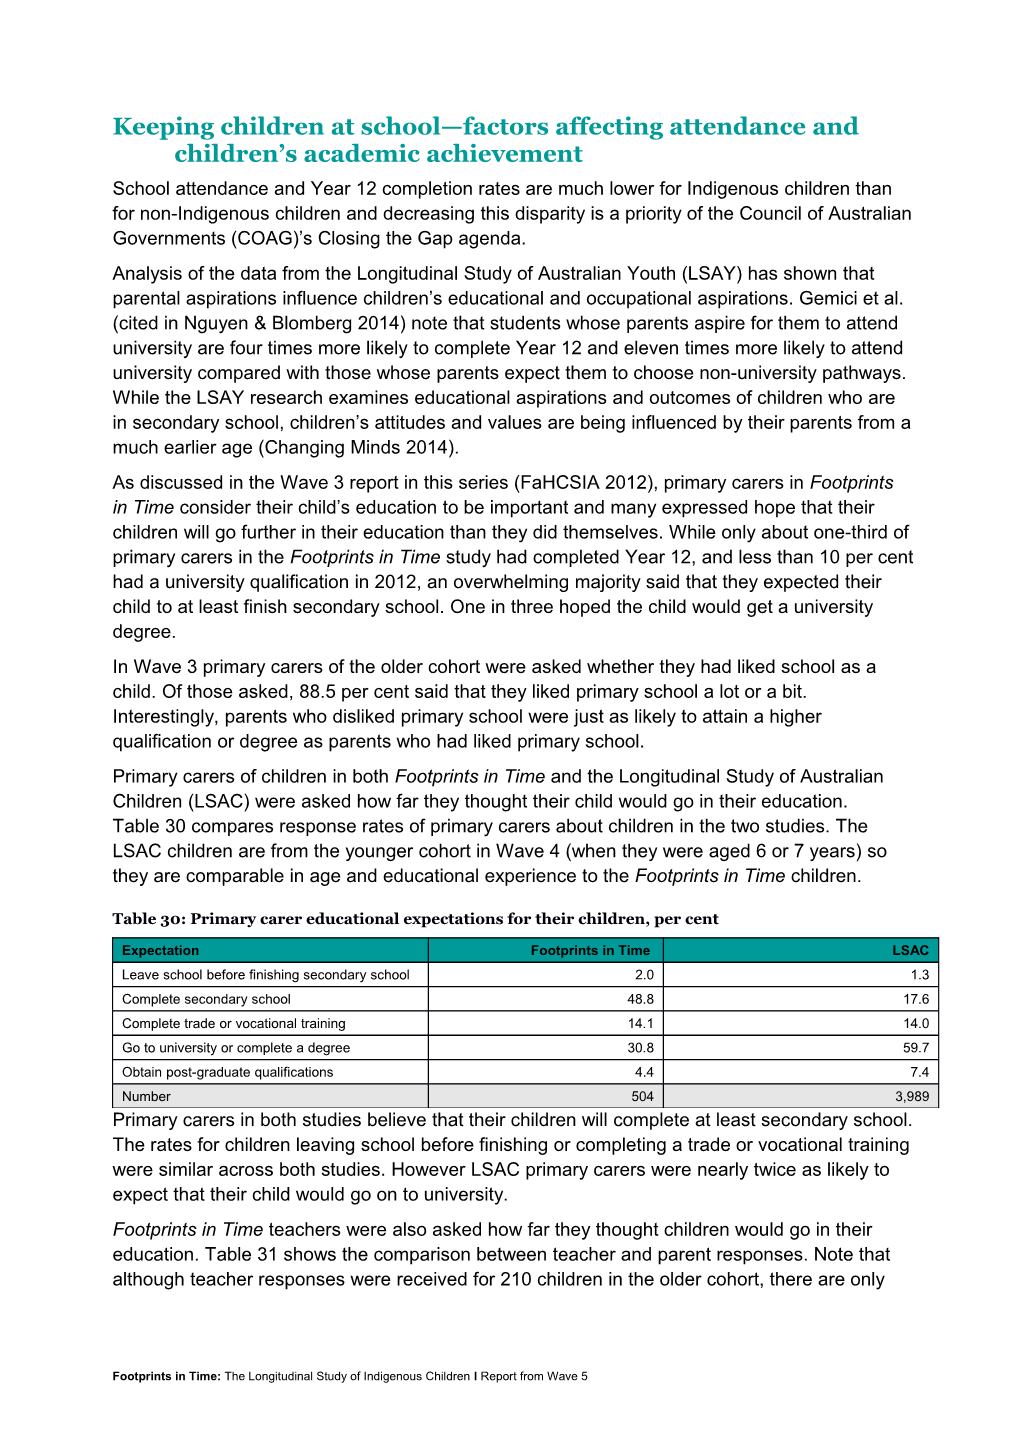
Primary carers of children in both Footprints in Time and the Longitudinal Study of Australian Children (LSAC) were asked how far they thought their child would go in their education. Table 30 compares response rates of primary carers about children in the two studies. The LSAC children are from the younger cohort in Wave 4 (when they were aged 6 or 7 years) so they are comparable in age and educational experience to the Footprints in Time children.
Table 30: Primary carer educational expectations for their children, per cent
Expectation / Footprints in Time / LSACLeave school before finishing secondary school / 2.0 / 1.3
Complete secondary school / 48.8 / 17.6
Complete trade or vocational training / 14.1 / 14.0
Go to university or complete a degree / 30.8 / 59.7
Obtain post-graduate qualifications / 4.4 / 7.4
Number / 504 / 3,989
Primary carers in both studies believe that their children will complete at least secondary school. The rates for children leaving school before finishing or completing a trade or vocational training were similar across both studies. However LSAC primary carers were nearly twice as likely to expect that their child would go on to university.
Footprints in Time teachers were also asked how far they thought children would go in their education. Table 31 shows the comparison between teacher and parent responses. Note that although teacher responses were received for 210 children in the older cohort, there are only 156 responses to this particular question. This may be influenced by the relatively young age and early stage of the children’s education.
Table 31: Teacher educational expectations for the children, per cent
Expectation / Primary carer / TeacherLeave school before finishing secondary school / 2.0 / 23.7
Complete secondary school / 48.8 / 30.8
Complete trade or vocational training / 14.1 / 19.9
Go to university or complete a degree / 30.8 / 24.4
Obtain post-graduate qualifications / 4.4 / 1.3
Number / 504 / 156
Footprints in Time teachers are much more likely to say that children will leave school before finishing secondary school than are primary carers. However both teachers and primary carers are more likely to expect that children will complete secondary school or complete a degree than other options although teachers expect lower proportions for both categories. If primary carer responses are restricted to the sample for those with responses from both primary carer and teacher, primary carer responses do not differ much from those shown in the table.
Table 32 shows that primary carers have relatively high expectations for the children compared with the teachers. It is likely that primary carers and teachers have very different bases for their predictions: primary carers’ may be based more on their hopes and aspirations for their children while teachers’ may be based more on their observations to date of the child’s academic abilities and willingness to learn. However, there is evidence that schools and teachers with high expectations of their Indigenous students can increase engagement and achievement (Helme & Lamb 2011).
Teachers completed a series of questions about literacy and numeracy skills for children in both cohorts and approach to learning for children in the older cohort. Responses to these questions can be summed to create a measure of how well the children are doing in each of these three domains, as well combining the literacy and numeracy domains to create a measure of academic achievement. On average, children’s literacy was rated at 32.0 out of 50, numeracy at 27.2 out of 40 and approach to learning at 17.5 out of 24. On the combined literacy/numeracy measure children achieved an average of 60.0 out of 90. Table 32 shows the average combined literacy/numeracy scores and PAT Reading scores (open ended with a top score of 130 achieved in Wave 5) for each level of teacher prediction.
Table 32: Learning outcomes by teachers’ educational expectations
Teacher expectation / Teacher-rated achievement scale / PAT ReadingLeave school before finishing secondary school / 39.4 / 71.1
Complete secondary school / 63.3 / 84.9
Complete trade or vocational training / 64.1 / 86.0
Go to university or complete a degree / 73.7 / 93.3
Obtain post-graduate qualifications / 90.0 / 105.2
Number / 142 / 125
Note there are only two observations in the ‘obtain post-graduate qualifications’ category.
Overall, combined literacy/numeracy achievement scores and PAT Reading scores are significantly associated with teachers’ predictions of how far children will go in their education. Primary carer predictions were only significantly associated with higher combined literacy/numeracy achievement scores and PAT Reading scores if they thought their child would go to university or obtain a post-graduate qualification.
Many teachers of Footprints in Time children identified regular attendance as key to educational success. When asked about what works and does not work for the individual children and for Indigenous children in general, 98 out of 425 responses (23.0 per cent) mentioned attendance. The common theme through these responses was that attendance at school assisted children in their academic outcomes.
‘Continual attendance over the year contributes to continuity of learning, routines, friendships.’
‘Regular attendance at kindergarten is paramount.’
‘Parents are not seeing that attendance patterns in preschool are a predictor of later school attendance.’
‘What is difficult for Indigenous children is being away from preschool for long periods of time when family visit other communities/the community of their family. The long break can be difficult for children to reconnect with school. The other problem is preschool/school attendance is often asked ‘Do you want to go today?’
‘In general—when students are made to go to school every day, their learning improves greatly. Not working—students as little as [pre-year 1], being given choices by carers about attending school.’
Teachers were asked to estimate to the nearest 10 per cent the attendance rate since the beginning of the year of children in the older cohort.[1] Of the 199 children for whom their teachers provided a response, more than half (61.3 per cent) had attendance rates of at least 90 per cent and 77.9 per cent had attendance rates of at least 80 per cent. Just over 9 per cent had been present for 50 per cent or less of the time. However, teachers of children whose attendance was very poor may not have felt they knew the child well enough to complete the survey. This data should therefore not be used to make assumptions about school attendance rates of Indigenous children in general.
However, the data can be used to examine differences within the group. Using the combined literacy/numeracy achievement scores it is possible to look at the impact of attendance on children’s learning outcomes. Children who attended less than 80 per cent of the time had average scores 20 points lower than children whose attendance was more regular (p<0.001).
Children with excellent or very good health had better attendance rates than those with good or fair health: 83.3 per cent of children with better health attended school at least 80 per cent of the time compared with 65.0 per cent of the time for children with poorer health. Of the 142 children for whom teachers reported reasons for absences, illness was the most common reason with 77.5 per cent of those children being away due to illness. Poorer health was also associated with poorer outcomes for both literacy and numeracy. Children with poorer health had literacy scores 5.7 points lower and numeracy scores 3.2 points lower.
Another common theme to teacher responses about what works well for Indigenous children is the importance of parental and family support, not only in terms of their attendance but also their academic outcomes. There were 94 (22.1 per cent) children for whom teachers mentioned the importance of family support. One teacher provided the following quote.
‘Parent involvement and cooperation in getting children to school with healthy food on time’.
Teachers were asked how involved they believed the parents to be in the children’s learning and development. Table 33 shows the relationship between teacher-reported parent involvement and children’s learning outcomes.
Table 33: Average scores by teacher-reported parent involvement, Wave 5
Level of involvement / Literacy scores / Numeracy scores / PAT Reading scoresNot involved / 27.1 / 23.3 / 72.6
Somewhat involved / 30.3 / 26.6 / 84.2
Very involved / 37.5 / 30.3 / 88.2
Don’t know parents enough to comment / 30.2 / 26.3 / 84.7
The table clearly shows the same pattern of impact across the three learning outcomes. Children whose primary carers are more involved in their development demonstrate better literacy and numeracy outcomes. However, only being ‘very involved’ is statistically different from being ‘not involved’.
While many primary carers expect that their child will complete secondary school, 67.3 per cent had not finished Year 12 themselves. However, children whose primary carer had completed Year 12 were more likely to have higher school attendance rates (attendance of at least 80 per cent) and also have an average literacy and numeracy scores of 10.7 points higher. Although the Footprints in Time children are as yet in the early stages of their education and there is plenty of time for changes to occur, attendance and parental support are already showing important associations with children’s educational outcomes.
For references and appendices cited in this research, please refer to the full version of the Footprints in Time: the Longitudinal Study of Indigenous Children Report from Wave 5.
Footprints in Time: The Longitudinal Study of Indigenous Children I Report from Wave 5
[1] As teachers complete the forms at different times of the year, this period will be different for each child.