Geog 577 Advanced Remote Sensing
Spring 2008
Due: 11:59pmFeb21, 2007
Lab 3 Image Transformation
1. Objectives
(1)Understand the theory and implementation of Principal Component Analysis (PCA)
(2)Understand the theory and implementation of Tasseled Cap Transformation
2. Theory
2.1 Principal Component Analysis (PCA)
PCA is one of the most commonly used data transformation in data analysis. Given a data matrix An×m that contains m variables and n observations, PCA is to transform An×m data matrix to a new set of matrix, Bn×m, with the same dimensions, i.e. the number of components is equal to the number of variables. An×m and Bn×m contains the exact same amount of information. However, PCA makes the components independent to each other. Moreover, PCA compresses information in An×m to the first few components in Bn×m as much as possible. Therefore, we only need the first few components in Bn×m, the principal components, to represent An×m. Given An×m, we usually have m eigenvalues from the variance-covariance matrix or correlations coefficient matrix:
λ1, λ2, …, λm
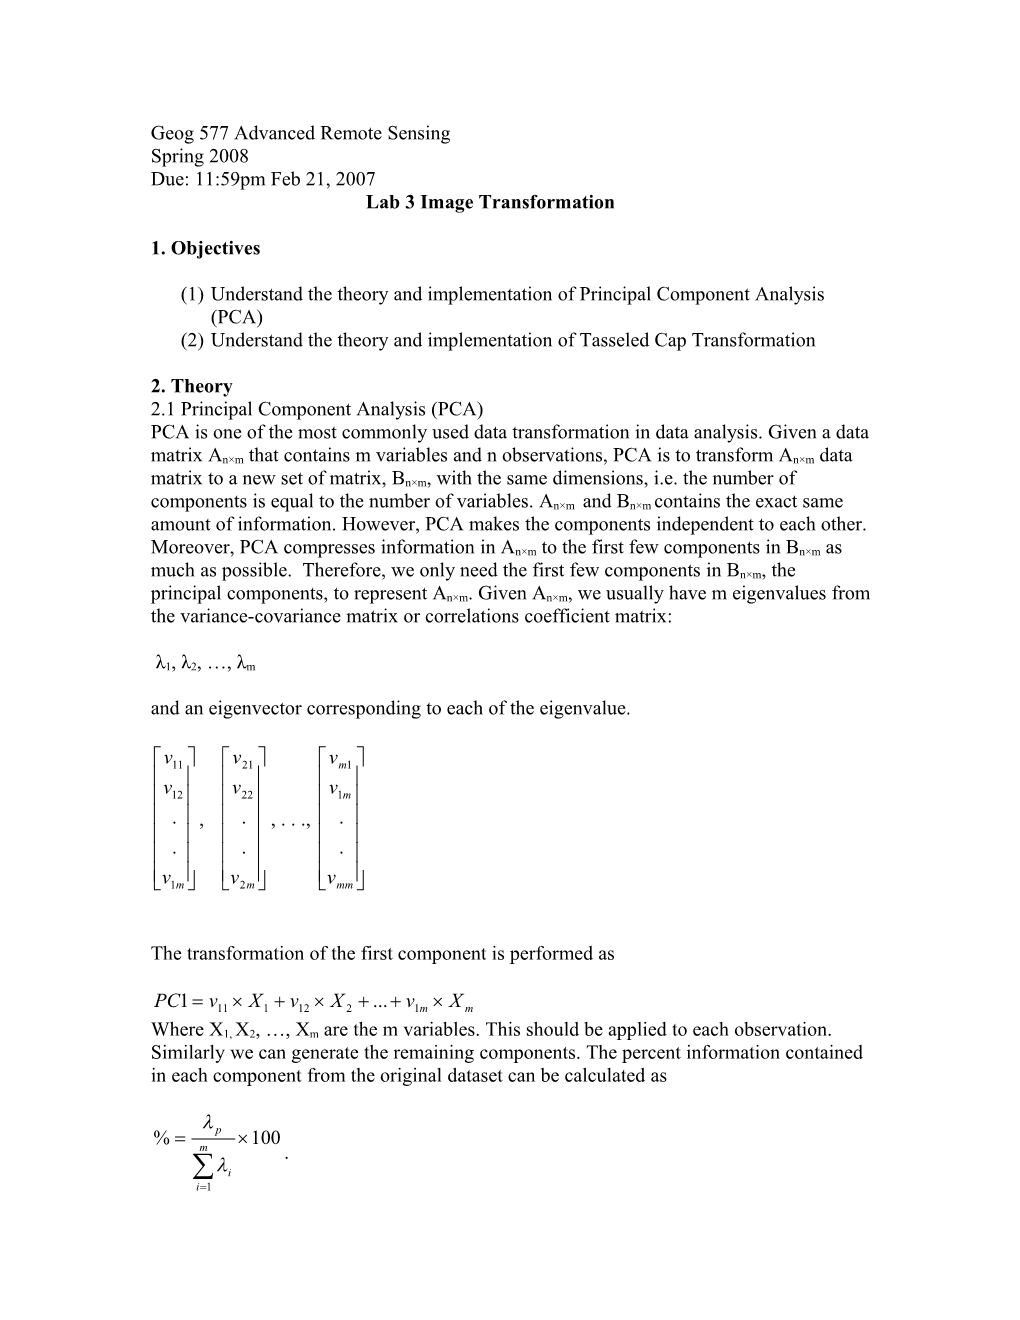
and an eigenvector corresponding to each of the eigenvalue.
, , . . .,
The transformation of the first component is performed as
Where X1, X2, …, Xm are the m variables. This should be applied to each observation. Similarly we can generate the remaining components. The percent information contained in each component from the original dataset can be calculated as
.
2.1 Tasseled Cap Transformation (Kauth-Thomas Transformation)
Tasseled Cap transformation is similar to PCA. The transformation produces three components (sometimes called indices), brightness, greenness and wetness. The difference is that name of the three components reflects its content, and the coefficient is fixed for all images for collected by a certain satellite. Please also not that PCA is a general mathematical data transformation approach. It can be used to any dataset. Tasseled Cap transformation is developed for remotely sensed data only, and it is sensor dependent, meaning a different set of coefficients should be used for Landsat 4, 5 and 7.. Those coefficients are the same for the same sensor regardless when and where the images are collected. Before using the coefficient to your image, you need to convert the DN to surface reflectance (sometimes to at sensor reflectance if no data is available for atmospheric correction).
3. Steps
(1)Have your atmospherically corrected image ChapelHill-etm24may2002.ref.img ready. Make sure it is in surface reflectance and done correctly.
(2)Start Imagine. Click Interpreter on the main menu bar. Then select Spectral Enhancement…/Principal Comp…. The Principal Components window will pop up.
(3)Select your atmospherically corrected Chapel Hill image that you created in lab 1 as the Input File, and set the Output File as ChapelHill-etm24may2002-pca.img. Set Data Type for Output as Float Single. Set the Number of Components Desired as 6.
(4)Check the box next to Write to File under Eigen Matrix and Eigen Values. Make sure that your files are save at the correct location. The eigenmatrix file should be saved as “ChapelHill-etm24may2002-pca.mtx” and the eigenvalues should be save as “ChapelHill-etm24may2002-pca.tbl”. Then click OK. Your principal component images will be ready in a few seconds.
(5)Open ChapelHill-etm24may2002-pca.img in a viewer and make the band combination as RGB=123, and open ChapelHill-etm24may2002.ref.img in another viewer making RGB=432 and put the two viewer windows side by side and describe the difference in the images.
(6)Open ChapelHill-etm24may2002-pca.tbl with Excel, and calculate the percent information contains in each component. How many components are needed in order to have 95% of the original information? Please include you eigen values in your lab report.
(7)Open ChapelHill-etm24may2002-pca.mtx with Excel. The first column is the eigen vector corresponding to the first eigen value. Please explain the content for the first three components in PCA based on the magnitude and sign of the eigen vector. To assist your explanation, please change the band combination in the PCA image viewer to RGB=111, RGB=222 and RGB=333 respectively to see what are the features highlighted (brightest). Please also set the RGB=444, 555 and 666 to see how they look like. Can you explain why?
(8)We’ve done with PCA, let move to TC transformation. Click Interpreter in the main menu. Select Spectral Enhancement…/Tasseled Cap …. The Tasseled Cap window will appear.
(9)Set the Input File as ChapelHill-etm24may2002-ref.img and out put image as ChapelHill-etm24may2002-tc.img. Select Landsat 7 Multispectral for sensors. Click the TC Coefficients tap below, you should see the coefficients. If you set the Sensor for Landsat 5 TM you will see a different set of coefficients. Then Click OK. Your TC image will be computed in a few seconds. Unfortunately, there is a bug in the software that causes this operation not working properly. Let set the Sensor to Landsat 7 Multispectral and click the TC coefficient tab. We will use the coefficients below and using the Model Moduler to generate brightness, greenness and wetness index and then stack them as one image named as ChapelHill-etm24may2002-bgw.img. This step is left as an exercise to this lab for you to figure out as we used the Moduler already in lab 1. Please be careful that the first Row of the coefficients should be used to generate brightness, and second row of the coefficients should bused to generate the greenness, and the third for wetness.
(10)Open ChapelHill-etm24may2002-bgw.img in a third viewer, and see the band combinations to RGB=123. compare with the original image (RGB=453). Compare the PCA and BGW image and see how they differ.
(11)Based on the eigen vector, which component of TC transformation does each of the first three PCA most resemble? Why? How do you validate your explanation with the images at hand.