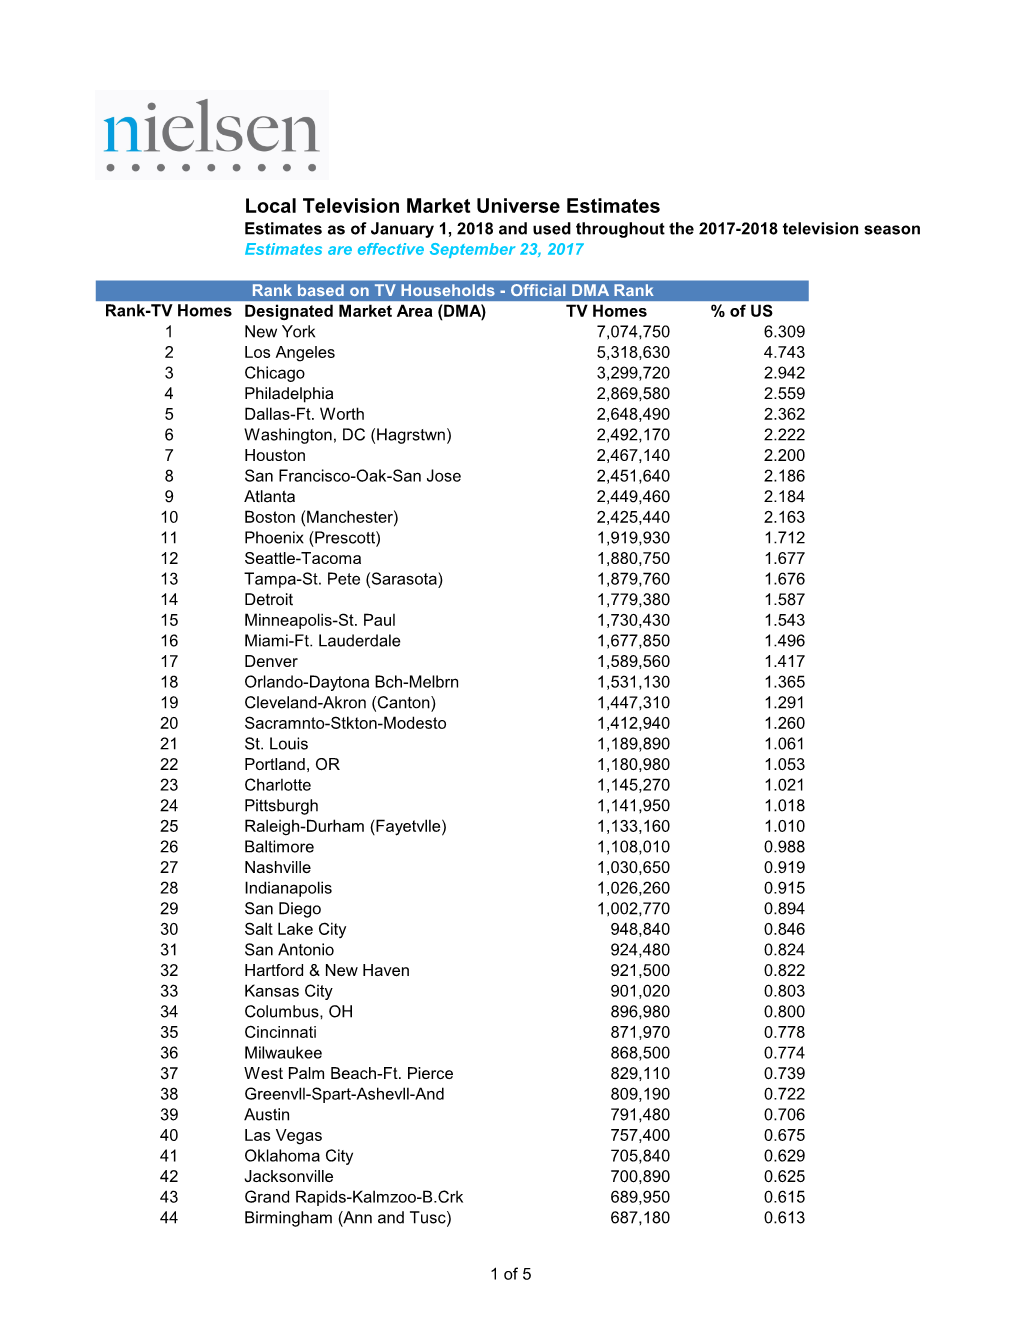
Local Television Market Universe Estimates
Estimates as of January 1, 2018 and used throughout the 2017-2018 television season
Estimates are effective September 23, 2017
Rank based on TV Households - Official DMA Rank
Rank-TV Homes
Designated Market Area (DMA) TV Homes % of US
1New York 7,074,750 6.309
2Los Angeles 5,318,630 4.743
3Chicago 3,299,720 2.942
4Philadelphia 2,869,580 2.559
Dallas-Ft. Worth 52,648,490 2.362
Washington, DC (Hagrstwn) 62,492,170 2.222
Houston 72,467,140 2.200
San Francisco-Oak-San Jose 82,451,640 2.186
Atlanta 92,449,460 2.184
10 Boston (Manchester) 2,425,440 2.163
11 Phoenix (Prescott) 1,919,930 1.712
13 Tampa-St. Pete (Sarasota) 1,879,760 1.676
15 Minneapolis-St. Paul 1,730,430 1.543
16 Miami-Ft. Lauderdale 1,677,850 1.496
18 Orlando-Daytona Bch-Melbrn 1,531,130 1.365
19 Cleveland-Akron (Canton) 1,447,310 1.291
21 St. Louis 1,189,890 1.061
22 Portland, OR 1,180,980 1.053
25 Raleigh-Durham (Fayetvlle) 1,133,160 1.010
29 San Diego 1,002,770 0.894
30 Salt Lake City 948,840 0.846
31 San Antonio 924,480 0.824
32 Hartford New Haven 921,500 0.822
33 Kansas City 901,020 0.803
12 Seattle-Tacoma 1,880,750 1.677
14 Detroit 1,779,380 1.587
17 Denver 1,589,560 1.417
20 Sacramnto-Stkton-Modesto 1,412,940 1.260
23 Charlotte 1,145,270 1.021
24 Pittsburgh 1,141,950 1.018
26 Baltimore 1,108,010 0.988
27 Nashville 1,030,650 0.919
28 Indianapolis 1,026,260 0.915
34 896,980 0.800 Columbus, OH
35 871,970 0.778 Cincinnati
36 868,500 0.774 Milwaukee
37 829,110 0.739 West Palm Beach-Ft. Pierce
38 809,190 0.722 Greenvll-Spart-Ashevll-And
39 791,480 0.706 Austin
40 757,400 0.675 Las Vegas
41 705,840 0.629 Oklahoma City
42 700,890 0.625 Jacksonville
43 689,950 0.615 Grand Rapids-Kalmzoo-B.Crk
44 687,180 0.613 Birmingham (Ann and Tusc)
1 of 5 Local Television Market Universe Estimates
Estimates as of January 1, 2018 and used throughout the 2017-2018 television season
Estimates are effective September 23, 2017
Rank based on TV Households - Official DMA Rank
Rank-TV Homes
Designated Market Area (DMA) TV Homes % of US
45 Harrisburg-Lncstr-Leb-York 682,460 0.609
58 Little Rock-Pine Bluff 522,530 0.466
59 Mobile-Pensacola (Ft Walt) 522,260 0.466
65 Tucson (Sierra Vista) 433,330 0.386
46 Albuquerque-Santa Fe 674,930 0.602
47 Norfolk-Portsmth-Newpt Nws 673,820 0.601
51 New Orleans 638,020 0.569
52 Providence-New Bedford 597,990 0.533
56 Ft. Myers-Naples 549,760 0.490
57 Wilkes Barre-Scranton-Hztn 523,450 0.467
67 Wichita-Hutchinson Plus 416,400 0.371
68 Des Moines-Ames 416,020 0.371
69 Green Bay-Appleton 415,890 0.371
71 Flint-Saginaw-Bay City 411,210 0.367
75 Springfield, MO 389,750 0.348
76 Rochester, NY 384,380 0.343
77 Columbia, SC 384,190 0.343
80 Huntsville-Decatur (Flor) 367,510 0.328
82 Paducah-Cape Girard-Harsbg 354,790 0.316
87 Colorado Springs-Pueblo 344,250 0.307
48 Greensboro-H.Point-W.Salem 672,650 0.600
49 Louisville 657,030 0.586
50 Memphis 649,360 0.579
53 Buffalo 592,750 0.529
54 Fresno-Visalia 574,610 0.512
55 Richmond-Petersburg 566,930 0.506
60 Albany-Schenectady-Troy 521,820 0.465
61 Knoxville 516,920 0.461
62 Tulsa 516,540 0.461
63 Lexington 459,300 0.410
64 Dayton 453,960 0.405
66 Honolulu 419,540 0.374
70 Roanoke-Lynchburg 414,620 0.370
72 Spokane 410,900 0.366
73 Charleston-Huntington 406,310 0.362
74 Omaha 399,010 0.356
78 Toledo 379,120 0.338
79 Portland-Auburn 367,720 0.328
81 Madison 366,690 0.327
83 Shreveport 352,540 0.314
84 Harlingen-Wslco-Brnsvl-McA 351,810 0.314
85 Syracuse 350,100 0.312
86 Waco-Temple-Bryan 346,750 0.309
88 Champaign Sprngfld-Decatur 344,180 0.307
2 of 5 Local Television Market Universe Estimates
Estimates as of January 1, 2018 and used throughout the 2017-2018 television season
Estimates are effective September 23, 2017
Rank based on TV Households - Official DMA Rank
Rank-TV Homes
Designated Market Area (DMA) TV Homes % of US
89 Chattanooga 336,580 0.300
93 El Paso (Las Cruces) 318,260 0.284
91 Cedar Rapids-Wtrlo-IWC Dub 325,780 0.290
92 Charleston, SC 320,980 0.286
94 Baton Rouge 314,970 0.281
95 Jackson, MS 306,410 0.273
96 South Bend-Elkhart 297,680 0.265
90 Savannah 328,860 0.293
97 Burlington-Plattsburgh 294,020 0.262
98 Ft. Smith-Fay-Sprngdl-Rgrs 292,160 0.261
99 Tri-Cities, TN-VA 290,530 0.259
101 Myrtle Beach-Florence 281,550 0.251
100 Greenville-N.Bern-Washngtn 285,650 0.255
102 Davenport-R.Island-Moline 277,950 0.248
103 Evansville 264,890 0.236
104 264,300 0.236 Boise
105 263,990 0.235 Reno
106 263,110 0.235 Lincoln Hastings-Krny
107 262,020 0.234 Johnstown-Altoona-St Colge
108 257,570 0.230 Tallahassee-Thomasville
109 253,230 0.226 Tyler-Longview(Lfkn Ncgd)
110 252,660 0.225 Sioux Falls(Mitchell)
111 249,130 0.222 Ft. Wayne
112 249,090 0.222 Augusta-Aiken
113 240,560 0.214 Fargo
114 239,760 0.214 Yakima-Pasco-Rchlnd-Knnwck
115 238,990 0.213 Lansing
116 237,580 0.212 Springfield-Holyoke
117 234,120 0.209 Youngstown
118 233,370 0.208 Traverse City-Cadillac
119 231,570 0.206 Eugene
120 222,970 0.199 Macon
121 222,450 0.198 Lafayette, LA
122 222,210 0.198 Peoria-Bloomington
123 222,190 0.198 SantaBarbra-SanMar-SanLuOb
124 218,740 0.195 Montgomery-Selma
125 217,560 0.194 Monterey-Salinas
126 212,180 0.189 Bakersfield
127 206,520 0.184 Columbus, GA (Opelika, AL)
128 198,820 0.177 Corpus Christi
129 196,160 0.175 La Crosse-Eau Claire
130 191,440 0.171 Wilmington
131 179,920 0.160 Amarillo
132 179,370 0.160 Chico-Redding
3 of 5 Local Television Market Universe Estimates
Estimates as of January 1, 2018 and used throughout the 2017-2018 television season
Estimates are effective September 23, 2017
Rank based on TV Households - Official DMA Rank
Rank-TV Homes
Designated Market Area (DMA) TV Homes % of US
133 Columbus-Tupelo-W Pnt-Hstn 172,520 0.154
135 Columbia-Jefferson City 163,790 0.146
136 Medford-Klamath Falls 163,600 0.146
137 Monroe-El Dorado 161,950 0.144
134 Wausau-Rhinelander 166,030 0.148
138 Rockford 161,530 0.144
Topeka 139 161,010 0.144
Duluth-Superior 140 157,070 0.140
Minot-Bsmrck-Dcknsn(Wlstn) 141 156,240 0.139
Beaumont-Port Arthur 142 156,020 0.139
Salisbury 143 155,240 0.138
Odessa-Midland 144 153,830 0.137
Lubbock 145 153,370 0.137
Palm Springs 146 152,840 0.136
Anchorage 147 149,120 0.133
Sioux City 148 144,180 0.129
Wichita Falls Lawton 149 142,990 0.127
Erie 150 141,020 0.126
Panama City 151 137,830 0.123
Joplin-Pittsburg 152 136,740 0.122
Rochestr-Mason City-Austin 153 134,990 0.120
Albany, GA 154 134,510 0.120
Terre Haute 155 127,470 0.114
Bangor 156 125,970 0.112
Biloxi-Gulfport 157 124,130 0.111
Wheeling-Steubenville 158 121,320 0.108
Gainesville 159 121,060 0.108
Sherman-Ada 160 120,100 0.107
Binghamton 161 120,060 0.107
Idaho Fals-Pocatllo(Jcksn) 162 119,590 0.107
Bluefield-Beckley-Oak Hill 163 118,520 0.106
Missoula 164 113,110 0.101
Abilene-Sweetwater 165 107,760 0.096
Yuma-El Centro 166 105,690 0.094
Billings 167 105,470 0.094
Hattiesburg-Laurel 168 102,840 0.092
Clarksburg-Weston 169 97,020 0.087
Rapid City 170 0.085 95,320
Utica 93,930 171 0.084
Quincy-Hannibal-Keokuk 93,920 172 0.084
Dothan 92,300 173 0.082
Lake Charles 91,490 174 0.082
Harrisonburg 86,700 175 0.077
Elmira (Corning) 86,230 176 0.077
4 of 5 Local Television Market Universe Estimates
Estimates as of January 1, 2018 and used throughout the 2017-2018 television season
Estimates are effective September 23, 2017
Rank based on TV Households - Official DMA Rank
Rank-TV Homes
Designated Market Area (DMA) TV Homes % of US
177 Jackson, TN 85,540 0.076
178 Alexandria, LA 82,270 0.073
181 Bowling Green 77,360 0.069
186 Bend, OR 67,170 0.060
187 Grand Junction-Montrose 67,150 0.060
188 Lafayette, IN 66,710 0.059
179 Watertown 81,630 0.073
180 Marquette 78,000 0.070
182 Jonesboro 76,860 0.069
183 Charlottesville 72,320 0.064
184 Laredo 70,980 0.063
185 Butte-Bozeman 69,060 0.062
189 Lima 62,840 0.056
Twin Falls 190 62,360 0.056
Meridian 191 61,460 0.055
Great Falls 192 60,220 0.054
Greenwood-Greenville 193 58,410 0.052
Parkersburg 194 56,980 0.051
Eureka 195 56,660 0.051
San Angelo 196 54,100 0.048
Cheyenne-Scottsbluff 197 53,720 0.048
Casper-Riverton 198 52,190 0.047
Mankato 199 49,610 0.044
Ottumwa-Kirksville 200 42,990 0.038
St. Joseph 201 42,230 0.038
Fairbanks 202 35,180 0.031
Victoria 203 31,380 0.028
Zanesville 204 30,550 0.027
Helena 205 27,430 0.024
Presque Isle 206 25,480 0.023
Juneau 207 24,390 0.022
Alpena 208 15,360 0.014
North Platte 209 13,640 0.012
210 Glendive 4,030 0.004
NSI Total U.S. 100.000 112,143,960
Copyright © 2017 The Nielsen Company
All Rights Reserved
5 of 5
2017_2018_DMA_Ranks