AP StatisticsProject #1 – “Minute to Win it”
Your group (groups of 2 or 3) will be doing a project with both categorical and quantitative data analysis
Quantitative Analysis:
You must come up with an activity that:
- Can be done in class
- Can be done within one minute
- Can be measured (gives quantitative data)
Categorical Data Analysis:
- Come up with 2 variables that have only 2 answer choices
- Come up with hypotheses for each of the variables, for using a 1 prop Z test.
- Example: “Out of the 4 core subjects (Engl, Math, Sci, Hist), is Math your favorite subject?”
- Assuming that all are equitably liked, we would assume 25% (1/4) would say “Math”
- However we hope that more than 25% like math the best.
- Therefore, Ho: p = 0.25 and Ha: p > 0.25
- Come up with 3 variables that have 3+ answer choices.
- 2 of these will be used to create a 2-way table and do a Chi-Square Independence test. You will want to choose two variables that you think might have a dependence
- The other variable will be used to do a Chi-Square GOF test.
- You can always record more categorical variablesthan needed and more than one quantitative!
- You must also record gender (but this does not count as one of your categorical variables)
- You may not use: Handedness, grade, age, etc.
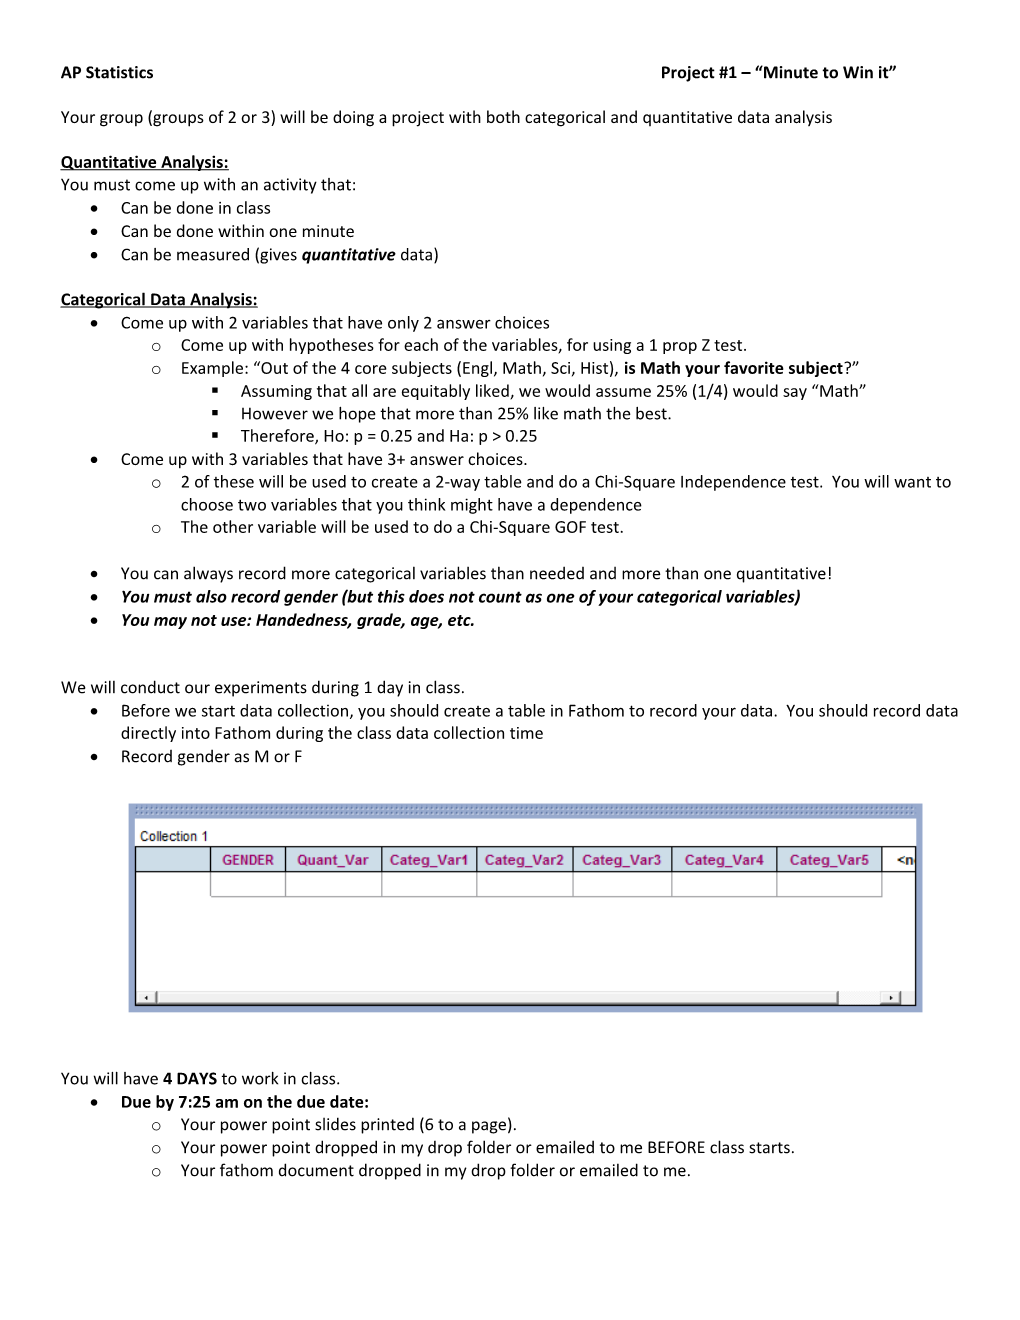
We will conduct our experiments during 1 day in class.
- Before we start data collection, you should create a table in Fathom to record your data. You should record data directly into Fathom during the class data collection time
- Record gender as M or F
You will have 4 DAYS to work in class.
- Due by 7:25 am on the due date:
- Your power point slides printed (6 to a page).
- Your power point dropped in my drop folder or emailed to me BEFORE class starts.
- Your fathom document dropped in my drop folder or emailed to me.
The power point:
INTRODUCTION
- Title slide, and introduction (tell what your project was about, how you collected data, what variables you recorded).
QUANTITATIVE ANALYSIS:
1)Overall Quantitative Variable Analysis
- Histogram and Boxplot of overall collected quantitative data
- Summary statistics (5 # summary, mean, std. deviation, IQR and count)
- Outlier test (Show all work)
- Complete description of the data (shape, center, spread, units)
- Comparison to normality (normal probability plot, and conclusion)
2)Perform a test of significance on the average value of your quantitative variable, using your hypotheses. Use alpha = 0.04.
3)Estimate the true average performance on your activity (quantitative variable) with an appropriate confidence interval.
4)Quantitative variable analysis compared to gender
- Bar graph of gender with counts and %’s listed
- Parallel boxplots and histograms of quantitative data broken down by gender
- summary statistics of each gender
- outlier test on each gender
- compare and describe both genders completely
5)Conduct a test of significance to decide if there is a difference between how males and females performed in your activity (average). Use alpha = 0.05
6)Complete an appropriate confidence interval to estimate the difference between how men and women performed on the activity.
Categorical Analysis:
For your variables with only 2 answer choices:
7)Create bar graphs of your two variables, listing the counts and percentages of each category of the variables
8)Pick one of the two variables and complete a 1 proportion Z test on the hypotheses that you predicted earlier. Use α = 0.03
- Be sure to show all important statistics (sample proportion, sample size, etc.)
9)Complete an appropriate confidence interval
Choose two of your variables that you believe are dependent and …
10)Exploratory Data Analysis
- Create a two-way table
- Create a stacked (segmented) bar graph of this table IN EXCEL. (remember, each bar should go up to 100%) Be sure to list percentages of each category in each bar.
11)Perform a Chi-Square test of independence on the variables.
- NOTE:Be sure to check the expected values condition before you do all your calculations. If the condition does not work, please see your teacher about help with combining categories of the variables
Using the third variable …
12)Exploratory Data Analysis
- Create a one-way table
- Create a bar graph of this variable, listing the counts and percentages of each category
13)Perform a Chi-Square Goodness of Fit test to see whether this variable is uniform.
- NOTE:Be sure to check the expected values condition before you do all your calculations. If the condition does not work, please see your teacher about help with combining categories of the variables
CONCLUSION:
14)Discussion of any sources of bias & error in your project
15)Conclusion (overall summary of what was discovered/learned from your data analysis, including comments on each of the numbered things above).
NOTES:
- For all tests of significance and intervals, be sure to appropriately check all conditions. If they are not met, please see your teacher.
- All slides should be printed (6 per page) and turned in.
- Power point should be emailed to me or dropped in my drop folder by 7:30 am on the due date
- Fathom file should also be emailed/dropped
- Presentations should be a minimum of 10 mins long and a maximum of 15 mins long. They should be a SUMMARY of the analysis that you have done (do not read word-for-word from the slides). There should be evidence that you have practiced the presentation before (no fumbling on which person is talking about which slide, no “ummmmms” while a person reads the slide and then decides what to say, etc.)
AP Statistics: Minute to Win It Project RubricNames:______
ITEMPOINTS DEDUCTED
ACTIVITY
Measurable (quantitative) data ____3
2 categorical variables____2
POWER POINT
Title slide____1
Introduction (how you collected the data, what you measured)____3
Minute to Win It
- Overall Quantitative Variable Analysis
Histogram and Boxplot of overall collected quantitative data____4
Summary statistics____3
Outlier test ____4
Complete description____4
Comparison to normality____2
- Test on average performance on activity ____16
Hypotheses, conditions, mechanics, conclusion
- Confidence interval for true average performance on activity____7
statement, mechanics, conclusion
- Quantitative variable analysis compared to gender
Bar graph of gender with counts and %’s listed____3
Parallel boxplots and histograms of quantitative data by gender____4
Summary statistics of each gender____6
Outlier test on each gender____6
Compare and describe both genders completely____8
- Test of significance on difference between genders in activity____22
Conditions, hypotheses, mechanics, conclusion
- Confidence Interval on diff. btw men and women in activity____8
Categorical Analysis
Variable with 2 values
- Bar Graphs with percentages/counts ____6
- Test of significance on your hypotheses____17
Hypotheses, conditions, mechanics, conclusion
- Appropriate Confidence Interval____ 7
Statement, mechanics, conclusion
Variables with 3+ Values
- Two-Way table with 2 variables_____2
- Segmented bar chart, with percentages of each category_____4
- Chi-Square Test of Independence_____20
Hypotheses, conditions, mechanics, conclusion
- One-way table with 3rd variable_____2
- Bar graph with counts and percentages listed_____3
- Chi-Square GOF test_____20
Hypotheses, conditions, mechanics, conclusion
Conclusion
- Discussion of any sources of bias & error____6
- Conclusion ____13
- Neat, organized, in power point, slides printed____10
- Fathom file dropped/emailed____3
- Presentation____20
- Days late (-one letter grade for each day late)______
TOTAL______/240