Education at a Glance: OECD Indicators (OECD, 2019[1]) is the authoritative source for information on the state of education around the world. It provides data on the structure, finances and performance of education systems in OECD and partner countries.
United Kingdom
•
In the United Kingdom, the average employment rate among tertiary-educated adults is
5 percentage points higher than among those with only an upper secondary or post-secondary nontertiary qualification.
•
The United Kingdom enrols the second largest number of international students in the OECD area after the United States. As a destination country, the United Kingdom accounts for 10% of the total international education market share in OECD and partner countries.
•
•
•
•
Tuitions fees in England are higher than in all OECD countries and economies except the United States.
Early childhood education and care (ECEC) is nearly universal in the United Kingdom for 3- and 4year-olds.
Among OECD countries, the United Kingdom spends the fourth highest proportion of its gross domestic product (GDP) on primary to tertiary educational institutions.
At pre-primary, primary and secondary levels, the average age of the teaching workforce in the United Kingdom has fallen since 2005 and it is now one of the youngest of all OECD countries.
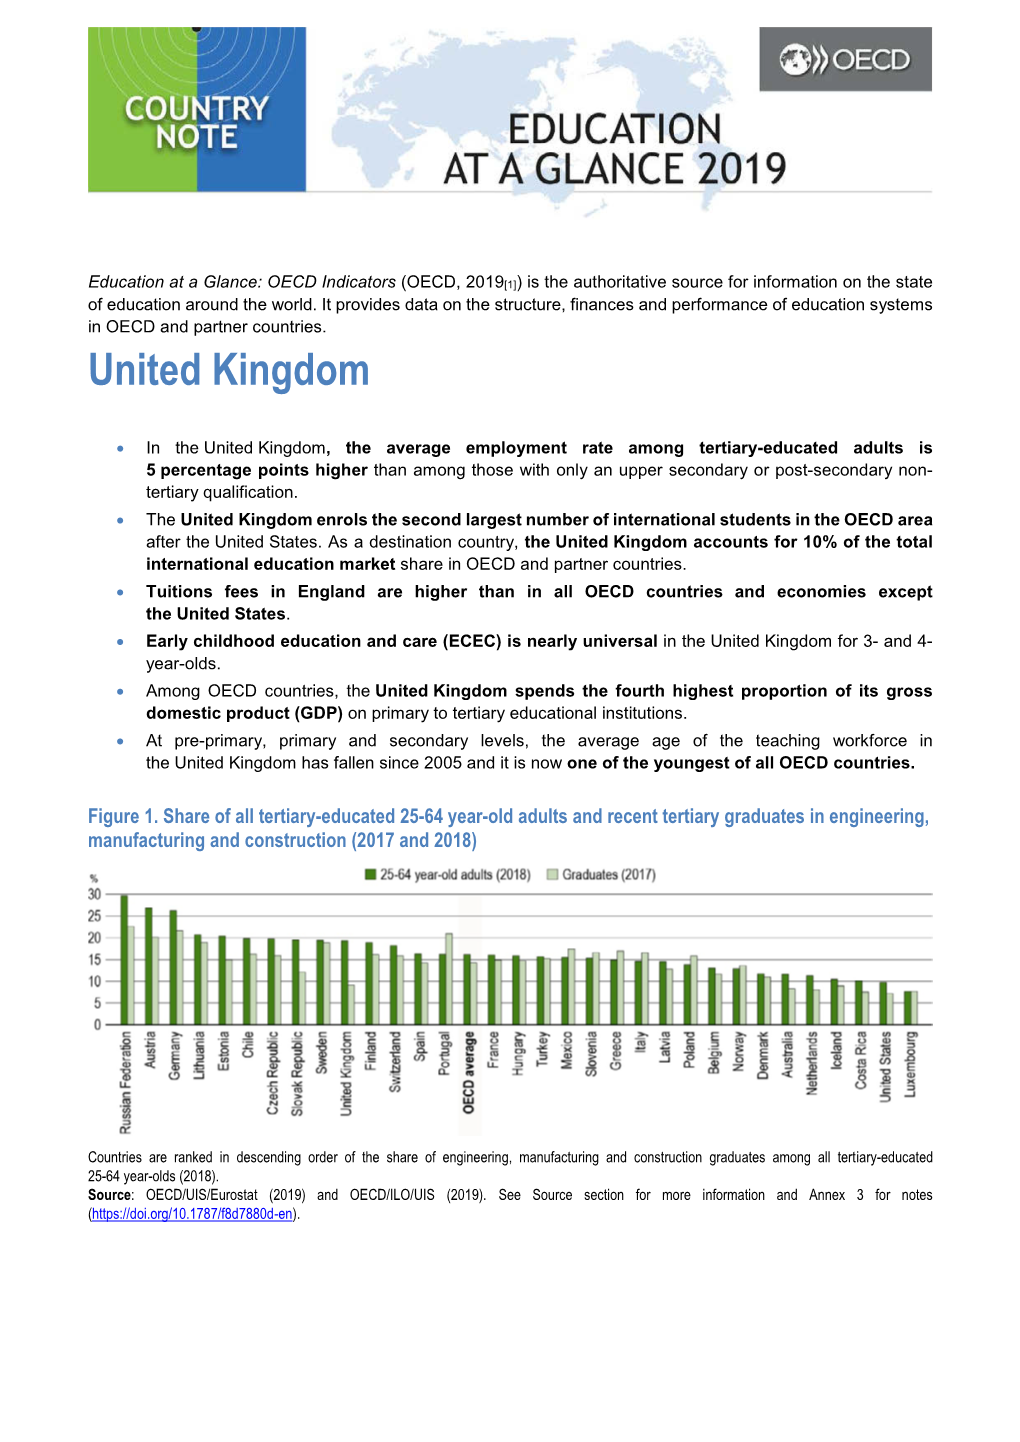
Figure 1. Share of all tertiary-educated 25-64 year-old adults and recent tertiary graduates in engineering, manufacturing and construction (2017 and 2018)
Countries are ranked in descending order of the share of engineering, manufacturing and construction graduates among all tertiary-educated
25-64 year-olds (2018).
Source: OECD/UIS/Eurostat (2019) and OECD/ILO/UIS (2019). See Source section for more information and Annex 3 for notes
(
2 |
Tertiary-educated workers do better in the labour market but their field of study has a profound impact
•
In the United Kingdom, the average employment rate for tertiary-educated adults is 5 percentage points higher than for those with only an upper secondary or post-secondary non-tertiary qualification. This is relatively low; only five other OECD countries have a smaller employment advantage. However, the employment rate for those with an upper secondary or post-secondary non-tertiary qualification in the UK is relatively high
•
•
Nearly one-quarter of 25-64 year-olds (23%) have a bachelor’s degree, which is 5 percentage points above the OECD average. The proportion of adults with a master’s or doctoral degree is similar to the OECD average.
However, there is considerable variation in the employment rate among tertiary-educated adults by field of study. The proportion of tertiary-educated adults who studied the broad fields of education, and natural sciences, mathematics and statistics are below the OECD averages. However, those who studied these fields have lower employment rates on average than those with only upper secondary or post-secondary non-tertiary education.
•
•
There is a relatively large difference in earnings advantage across fields of study in the United Kingdom.
Those with a degree in the best-paid field of study earn about twice as much as those with a degree in the worst-paid field of study. For example, those who studied natural sciences, mathematics or statistics earn over 180% of the earnings of a worker with only an upper secondary education. Meanwhile, those who studied arts, humanities, social sciences, journalism or information earn 92% of the earnings of a worker with an upper secondary education.
There is a substantial gap (more than 10 percentage points) between the share of tertiary-educated 25-
64 year-olds who studied engineering, manufacturing and construction and the share of recent graduates who have done so. (Figure 1) The share of recent graduates getting a degree in this field is less than half the share among the tertiary-educated population.
The United Kingdom has a well-developed system of financial support for tertiary students
•
In spite of high tuition fees and lower than average earning premiums for tertiary graduates, the gains
(over a lifetime) associated with a higher level of education still greatly exceed the cost of tertiary studies in the United Kingdom. However, the private net financial returns (the difference between the benefits and cost for the individual) are lower than in most countries. The net returns for women reach
USD 195 2001 in the United Kingdom compared to USD 227 600 on average across OECD countries.
The private returns for men are much higher than for women, at USD 245 100, but still lower than the OECD average of USD 295 900.
•
•
More education not only benefits individuals, but the society too. In the United Kingdom, the public cost of tertiary education is far outweighed by its benefits for the society through the additional tax and social contributions paid by graduates. Tertiary-educated men generate USD 147 700 in total benefits through income tax and social contributions while tertiary-educated women generate a total of USD 113 400.
Financial support to tertiary students comes in various forms across the United Kingdom. Wherever they study in the United Kingdom, English-domiciled students are provided with loans to cover tuition fees, while Welsh-domiciled students are provided with a mixture of grants and loans. The majority of Scottish undergraduate students studying in Scotland do not pay tuition fees, but have a loan provided if they
1 Values reported in equivalent US dollars (USD) have been converted using purchasing power parities (PPPs) for GDP.
© OECD 2019
| 3 study elsewhere in the United Kingdom, while the tuition fee cap is lower for Northern Irish students in
Northern Ireland.
•
•
In England, more than 90% of students only receive loans to cover the cost of their studies (for bachelor’s and master’s long first degrees). The average annual amount borrowed by each student is USD 17 033.
England replaced a mortgage-style loan system with an income-contingent loan system in 1999, fixing the conditions for the remission and forgiveness of student loans. Loans are written off 30 years after graduation. It is expected that as much as 45% of the financial value of student loans will not be repaid.
Figure 2. Incoming student mobility in tertiary education, by level of study (2017)
International or foreign student enrolment as a percentage of total enrolment in tertiary education
1. Share of foreign rather than international students.
2. Year of reference 2016.
Countries are ranked in descending order of the percentage of international or foreign students in tertiary education.
Source: OECD/UIS/Eurostat (2019). See Source section for more information and Annex 3 for notes (
The United Kingdom’s tertiary education system is very attractive to international students
•
•
English is the lingua franca of the globalised world, with one in four people using it worldwide (Sharifian,
2013[2]). Not surprisingly, English-speaking countries are the most attractive student destinations overall, with Australia, Canada, the United Kingdom and the United States receiving over half of all mobile students. In all these countries, tertiary institutions charge relatively high tuition fees (over USD 4 500 for bachelor’s degrees in public institutions). Fees for national students in England are higher than in all
OECD countries except the United States. Tertiary institutions charged tuition fees of USD 11 866 a year for a bachelor’s degree in 2017/18.
The United Kingdom enrols the second largest number of international students in the OECD area after the United States. Of the 3.7 million international students enrolled in OECD and partner countries, the United Kingdom hosts 436 000, which is far behind the 985 000 enrolled in programmes in the United States. As a destination country, the United Kingdom accounts for 10% of the total international education market share in OECD and partner countries.
© OECD 2019
4 |
•
•
Students from Asia form the largest group of international students enrolled in tertiary education programmes in the United Kingdom (53% in 2017), as they do across OECD member and partner countries (56%). A further 32% of the United Kingdom’s international students are from elsewhere in
Europe.
Across OECD countries, the proportion of international enrolment increases with the level of tertiary education. In the United Kingdom 42% of doctoral students are international compared to 34% of master’s students and 14% of bachelor’s students (Figure 2). All of these proportions are substantially higher than the OECD averages.
Figure 3. Expenditure on all children aged 3 to 5 enrolled in ECEC and primary education as a percentage of GDP (2016)
Public and private institutions
1. Expenditure on all children aged 3 to 5 are underestimated due to the estimation method used.
2. Public sources only.
Countries are ranked in descending order of expenditure as a percentage of GDP.
Source: OECD (2019). Table B2.4. See Source section for more information and Annex 3 for notes (
Enrolment in ECEC is nearly universal from the age of 3, with a significant share of the cost paid by households
•
Early childhood education and care (ECEC) is nearly universal in the United Kingdom for those aged 3 and 4, with higher enrolment rates than the OECD average. In 2016, 100% of 3-year-olds were enrolled in pre-primary education, compared to the OECD average of 77%.
•
•
Expenditure on all children aged 3 to 5 enrolled in ECEC and primary education amounts to 0.7% of GDP in the United Kingdom, which is above the OECD average of 0.6% (Figure 3).
The United Kingdom and Japan are the only OECD countries where private funds account for more than
40% of total expenditure on pre-primary education (ISCED 02). However, in the United Kingdom, most of the private funding comes from households, while in Japan the high cost is shared by households, foundations and the business sector.
•
The United Kingdom is one of only a few countries that makes extensive use of teachers' aides at the pre-primary level. The ratio of children to teaching staff is 23:1, well above the OECD average, however the ratio of children to contact staff (teachers and teachers' aides) is 3:1, well below the OECD average.
© OECD 2019
| 5
A large share of vocational upper secondary graduates are female, although there are significant gender differences in the fields studied
•
On average across OECD countries, 8% of graduates from upper secondary vocational programmes earned a qualification in the field of engineering, manufacturing and construction. This rises to 12% for business, administration and law, and 15% for health and welfare.
•
•
The United Kingdom is one of just five countries (along with Brazil, Colombia, Ireland, and New Zealand) where women make up a larger share of graduates from vocational programmes than general ones.
However, there is significant gender gap in the fields studied in vocational programmes. Women make up 80% of graduates in health and welfare compared to just 6% of graduates in engineering, manufacturing and construction. This pattern of gender disparity is common across OECD countries.
•
The United Kingdom spends USD 9 437 per student each year on upper secondary vocational programmes, which is below the OECD average of USD 10 922. It is unusual for an OECD country to spend more per student on upper secondary general programmes than on vocational programmes.
The United Kingdom is one of only six countries to do so, spending substantially more on its general programmes (USD 12 263 per student).
Expenditure on education is relatively high, with a large share of funding of tertiary educational institutions coming from private sources
•
Among OECD countries, the United Kingdom spends the fourth highest proportion of GDP on primary to tertiary educational institutions (6.2% compared to the OECD average of 5.0%), with above-average expenditure as a proportion of GDP at each level of education (Figure 4).
•
Total public expenditure in the UK (42.6% of GDP) is in line with the OECD average (42.3%). However, public expenditure on primary, secondary and post-secondary non-tertiary educational institutions as a percentage of GDP is appreciably higher than the OECD average (3.8% compared with 3.2%).
•
•
In 2016 the United Kingdom spent USD 11 061 per student in primary, secondary and post-secondary non-tertiary educational institutions. This is 18% higher than the OECD average of USD 9 357.
OECD countries spend on average 18% more per secondary student than they do per primary student.
However, the United Kingdom is one of a small group of countries that invests more per student at primary level than at secondary. In 2016, it spent USD 11 188 per student in primary (32% above the OECD average of USD 8 470) compared to USD 10 963 in secondary (10% above the OECD average).
•
Among the likely reasons for this is the fact that, unlike many other OECD countries, teachers’ salaries in the United Kingdom do not rise with the level of education. Other factors that influence relative spending on primary and secondary education include the age/experience distribution of teachers and the structure of bonuses and allowances for teachers.
•
•
Spending per student on tertiary institutions in the United Kingdom is USD 23 771 which is substantially above the OECD average of USD 15 556. Only three countries spend more per student: Sweden
(USD 24 341), the United States (USD 30 165) and Luxembourg (USD 48 407).
A relatively high share of the funding of tertiary educational institutions in the United Kingdom comes from the private sector. After transfers between the public and private sectors, private sources account for 68% of the total funding of tertiary educational institutions in the United Kingdom, of which about two-thirds comes from households. Across OECD countries, on average, 32% of the total funding of tertiary educational institutions comes from private sources.
© OECD 2019 6 |
Figure 4. Total expenditure on educational institutions as a percentage of GDP (2016)
From public, private and international sources, by level of education
1. Year of reference 2017
2. Primary education includes pre-primary programmes
Countries are ranked in descending order of total expenditure on educational institutions as a percentage of GDP.
Source: OECD/UIS/Eurostat (2019), Table C2.1. See Source section for more information and Annex 3 for notes
Teachers in the United Kingdom are among the youngest across OECD countries and earn less than average at all levels of education
•
•
•
In primary and lower secondary education, the average age of the teaching workforce in the United Kingdom has fallen since 2005 and it is now one of the youngest among all OECD countries.
Nearly one-third of primary teachers (31%) are aged 30 or younger, compared to 13% on average across
OECD countries.
In contrast to the general trend across OECD countries, teachers’ statutory salaries for those with
15 years of experience and the most prevalent qualification in England and Scotland have not recovered to their pre-Great Recession highs. In 2018, salaries in England are 10% lower than they were in 2005 and salaries in Scotland are 3% lower.
In England and Scotland, teachers at every level from pre-primary to upper secondary have the same starting salary. Salary levels in England and Scotland progress relatively rapidly compared to most OECD countries. After 15 years experience, teachers’ salaries have increased considerably, and are around or exceed the OECD average across all levels of education except upper secondary education in Scotland.
However, salary progression stops at, or before, 15 years of experience, and salaries at the top of the scale once more lag behind those in other OECD countries.
•
When bonuses and allowances are included, the average actual salaries of lower secondary teachers in
England and Scotland are lower than the average earnings of tertiary-educated workers, as in most countries. However, in Scotland this relative earnings gap is slightly higher than the OECD average.
© OECD 2019
| 7
References
[1]
[2]
OECD (2019), Education at a Glance 2019: OECD indicators, OECD Publishing, Paris,
Sharifian, F. (2013), “Globalisation and developing metacultural competence in learning English as an International Language”, Multilingual Education, Vol. 3/1, p. 7,
5059-3-7.
For more information on Education at
a Glance 2019 and to access the full set of Indicators, visit
Updated data can be found on line at and by following the under the tables and charts in the publication. Explore, compare and visualise more data and analysis using:
treshold=10 topic=EO.
Questions can be directed to: Country note author:
Etienne Albiser Bruce Golding
Directorate for Education and Skills
Directorate for Education and Skills
etienne.albiser@oecd.org bruce.golding@oecd.org
This work is published under the responsibility of the Secretary-General of the OECD. The opinions expressed and arguments employed herein do not necessarily reflect the official views of OECD member countries.
This document and any map included herein are without prejudice to the status of or sovereignty over any territory, to the delimitation of international frontiers and boundaries and to the name of any territory, city or area.
On 25 May 2018, the OECD Council invited Colombia to become a Member. While Colombia is included in the OECD averages reported in this note, at the time of its preparation, Colombia was in the process of completing its domestic procedures for ratification and the deposit of Colombia’s instrument of accession to the OECD Convention was pending.
Note regarding data from Israel
The statistical data for Israel are supplied by and are under the responsibility of the relevant Israeli authorities. The use of such data by the OECD is without prejudice to the status of the Golan Heights, East Jerusalem and Israeli settlements in the West Bank under the terms of international law.
© OECD 2019 8 |
Key Facts for the United Kingdom in Education at a Glance 2019
United Kingdom OECD average EU23 average
Source Main topics in Education at a Glance
Tertiary education
2018
Educational attainment of 25-64 year-olds
Short-cycle tertiary
Bachelor's or equivalent
Master's or equivalent
10% 7% 5%
23% 17% 14%
12% 13% 15%
1% 1% 1%
Table A1.1
Doctoral or equivalent
Tertiary attainment of 25-34 year-olds, by gender 2008 2018 2008 2018 2008 2018
38% 42% Men 48% 31% 28% 36%
51% 44% Women 54% 40% 38% 50%
44% 43% Total 51% 35% 33% 43%
Table A1.2
Table B4.1
2017
Distribution of first-time tertiary entrants by education level
Short-cycle tertiary
Bachelor's or equivalent
22% 17% 12%
77% 76% 80%
1% 7% 8%
Master's or equivalent
Share of international or foreign students, by education level1
2017
14% 4% 7%
Bachelor's or equivalent
Master's or equivalent
Doctoral or equivalent
All tertiary levels of education
Employment rate of 25-64 year-olds, by educational attainment
Short-cycle tertiary
Bachelor's or equivalent
Master's or equivalent
Doctoral or equivalent
All tertiary levels of education
13% 34% 13%
22% 42% 22%
6% 18% 9%
2018
Table B6.1
Table A3.1
83% 82% 82%
87% 84% 84%
87% 88% 88%
90% 92% 93%
86% 85% 86%
2018
Employment rate of tertiary-educated 25-64 year-olds, by field of study
79% 84% 85%
85% 86% 87%
88% 89% 89%
83% 87% 88%
Education
Business and administration and law
Engineering, manufacturing and construction
Health and welfare
Table A3.4
Relative earnings of full-time full-year 25-64 year-old workers, by educational attainment (upper secondary education = 100)
2017
113 120 121
142 144 138
165 191 174
142 157 152
Short-cycle tertiary
Bachelor's or equivalent
Master's, doctoral or equivalent
All tertiary levels of education
Table A4.1
Table A1.2
Upper secondary and vocational education and training (VET)
2018
Upper secondary or post-secondary non-tertiary attainment rate
Share of 25-34 year-olds with upper secondary or post-secondary nontertiary as their highest attainment
34% 41% 44%
Percentage of first-time upper secondary graduates with a vocational qualification
2017
40% 63% 46%
Figure B3.1
Table B3.1 Vocational programmes
Age at graduation from upper secondary education, by programme orientation
2017
17 18 19
20 21 21
General programmes
Vocational programmes
Share of women among upper secondary graduates, by programme orientation
2017
50% 55% 56%
52% 46% 46%
General programmes
Vocational programmes
Employment, unemployment and inactivity rates of 25-34 year-olds, with upper secondary or post-secondary non-tertiary education
Figure B3.2
Table A3.3
2018
84% 78% 79%
4% 7% 8%
13% 16% 14%
Employment rate
Unemployment rate
Inactivity rate
Total expenditure on upper secondary educational institutions, in USD2 per full-time equivalent student, by programme orientation
2016
USD 12 263 USD 9 397 USD 9 671
USD 9 437 USD 10 922 USD 11 320
General programmes
Vocational programmes
Table C1.1
Early childhood education and care (ECEC)
Enrolment rate of 3-5 year-olds in education
Table B2.2 ECEC and primary education
2017
100% 87% 90%
2017
34% 49% 27%
Share of children enrolled in private institutions
United Kingdom Education at a Glance 2019