PRACTICE TEST #3 (SOLUTIONS)
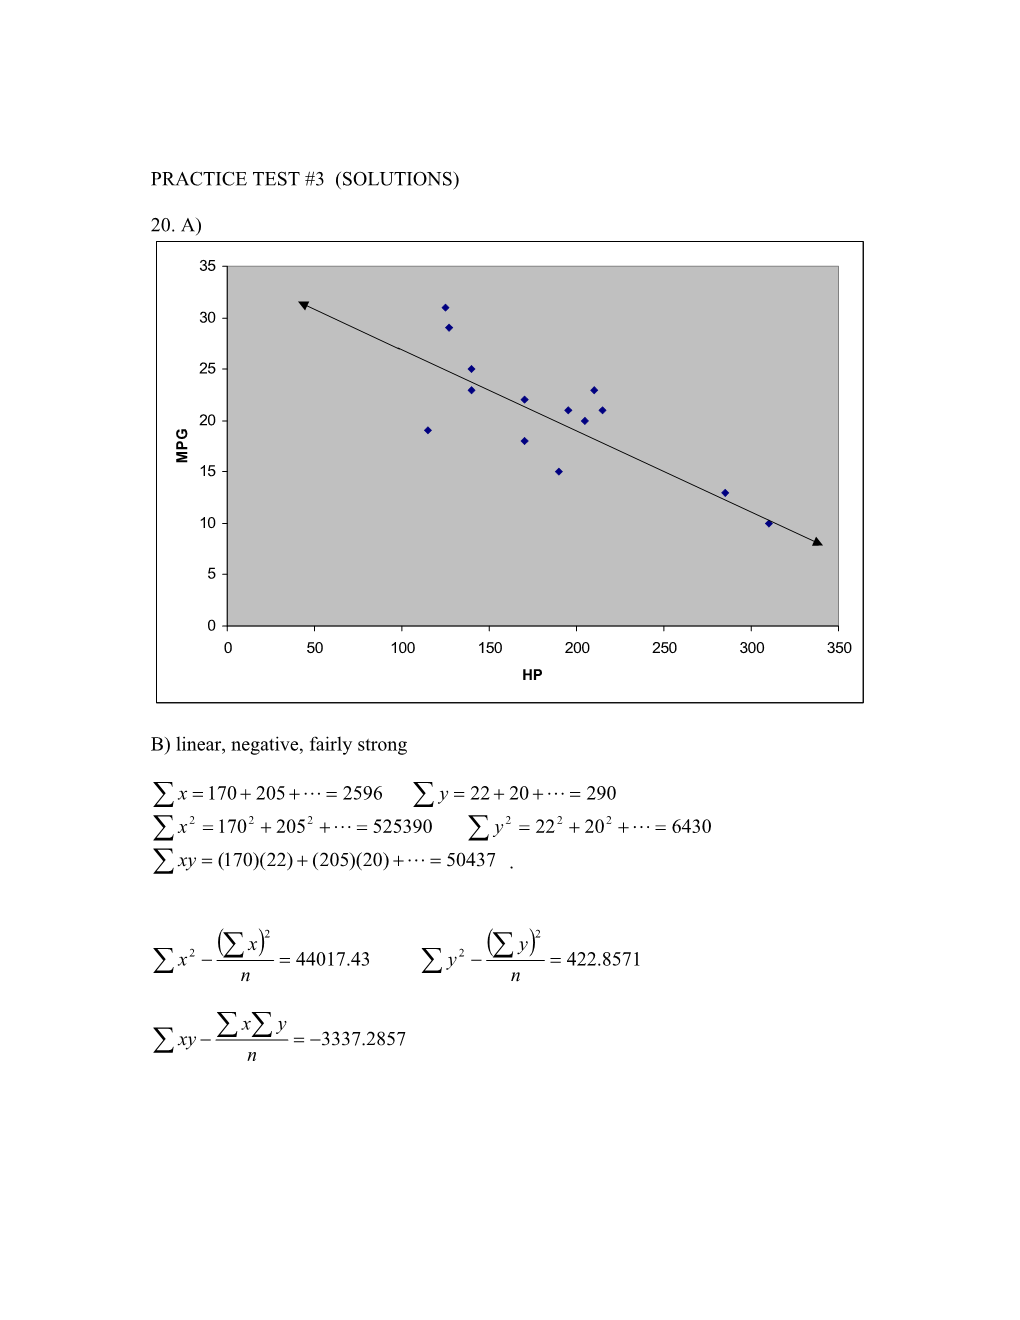
20. A)
B) linear, negative, fairly strong
.
C) =
D) =
=
or Plugging in x = 100 we get y = 27.19 and plugging in x = 250 we get y = 15.82. Next we plot the points and draw the line in the graph above.
E) 15.82 MPG (work in part D)
F) Good or bad is an OK answer, if the reasons are right:
GOOD: high correlation, 250 is near middle of the data are reasons
BAD: somewhat small sample size, correlation could be higher
From looking at the graph it looks like the prediction should be within +/- 5 or 10 MPG
G) For every additional HP the best guess is that the MPG goes down by .0758. Or for every additional 100 HP the MPG goes down by 7.58.
H)
23. A) White murderers: 23/153 = 15.03% got death penalty
Black murderers: 12/62 = 19.35% got death penalty
Blacks had a higher chance of getting death penalty.
B) White murderers: 1/12 = 8.33% got death penalty
Black murderers: 10/107 = 9.35% got death penalty
Blacks had a higher chance of getting death penalty.
C) White murderers: 24/165 = 14.55% got death penalty
Black murderers: 22/169 = 13.02% got death penalty
Whites had a higher chance of getting death penalty.
24.
Student Meetings / Faculty MeetingsSugar / 50 / 20
Chocolate Chip / 102 / 55
Oatmeal / 66 / 42
Peanut Butter / 44 / 18
Totals / 262 / 135
Student Meetings / Faculty Meetings
Sugar / 50/262 = 19.1% / 20/135 = 14.8%
Chocolate Chip / 102/262 = 38.9% / 55/135 = 40.7%
Oatmeal / 66/262 = 25.2% / 42/135 = 31.1%
Peanut Butter / 44/262 = 16.8% / 18/135 = 13.3%
75.
percents not as in
Visa / MC / AE / OtherO / 140 / 96 / 24 / 40 / 300
E / (300)(50%) = 150 / (300)(30%) = 90 / (300)(10%)=30 / 30 / 300
df = 4 – 1 = 3
Picture of how ’s would be distributed if the percentage were as claimed in . The best evidence is in the right tail with area 10%.
NO
76. . same percent for each category, namely
percents not as in
each
O’s / Red / Green / SilverAlmonds / 45 / 51 / 48
Peanuts / 55 / 50 / 48
No Nuts / 60 / 47 / 46
df = 9 – 1 = 8
Picture of how ’s would be distributed if the percentages were all the same. The best evidence is in the right tail with area 5%.
NO
77. 3.68 falls between 3.490 and 13.362 on the table with df = 8. So the p-value is between 10% and 90% (much closer to 90%).
If the percents are equal, the chance we would get evidence as strong as or stronger than we got that they differ is between 10% and 90%. This is assuming all conditions were met and the data were gathered properly.
78. wrapping color and nuts independent
some relationship between wrapping color and nuts
df = (3-1)(3-1) = 4
O’s / Red / Green / SilverAlmonds / 45 / 51 / 48
Peanuts / 55 / 50 / 48
No Nuts / 60 / 47 / 46
E’s / Red / Green / Silver
Almonds / (144)(160)/450 = 51.2 / (144)(148)/450 = 47.36 / (144)(142)/450 = 45.44 / 144
Peanuts / (153)(160)/450 = 54.4 / (153)(148)/450 = 50.32 / (153)(142)/450 = 48.28 / 153
No Nuts / (153)(160)/450 = 54.4 / (153)(148)/450 = 50.32 / (153)(142)/450 = 48.28 / 153
160 / 148 / 142 / 450
Picture of how ’s would be distributed if they were independent. The best evidence is in the right tail with area 5%.
NO
79. 2.0995 falls between 1.064 and 7.779 on the table with df = 4. So the p-value is between 10% and 90% (closer to 90%).
If there is no relationship, the chance we would get evidence as strong as or stronger than we got that there is some relationship is between 10% and 90%. This is assuming all conditions were met and the data were gathered properly.
80. unknown
81. all means equal
some difference
Recall: so
Airline V / Airline W / Airline X / Airline Y / Airline Zdata / 79, 84, 84, 87 / 72, 76, 72, 80, 72, 78 / 82, 84, 80, 77, 80 / 84, 85, 81, 87 / 75, 75, 75, 70, 70
/ 334 / 450 / 403 / 337 / 365
/ 27922 / 33812 / 32509 / 28411 / 26675
/ 4 / 6 / 5 / 4 / 5
/ / 75 / 80.6 / 84.25 / 73
/ 11 / 12.4 / 6.8 / 6.25 / 7.5
The biggest standard deviation is which is no more than double the smallest which is , so we are ok. (You do not have to check this on a test question.)
and
=
We look on theF table with 4 degrees of freedom on the top and 19 on the bottom (left side of table) to get . Note the right hand tail in the picture is 5%.
The answer is YES since 13.282 is to the right of 2.8951.
82. 5% or less
83. Summary of work from #20
or
Plugging in x = 250 we get y = 15.82.
A)
df = 14 – 2 =12
this is a left tail test YES
3.762
B) or
C) or
D) Plugging in x = 16000 we get y = -1178.03
. or
E) Its hilarious! Nonsense from such extrapolation.