Grade 9 Academic Geography
Strand 3 Practice Test
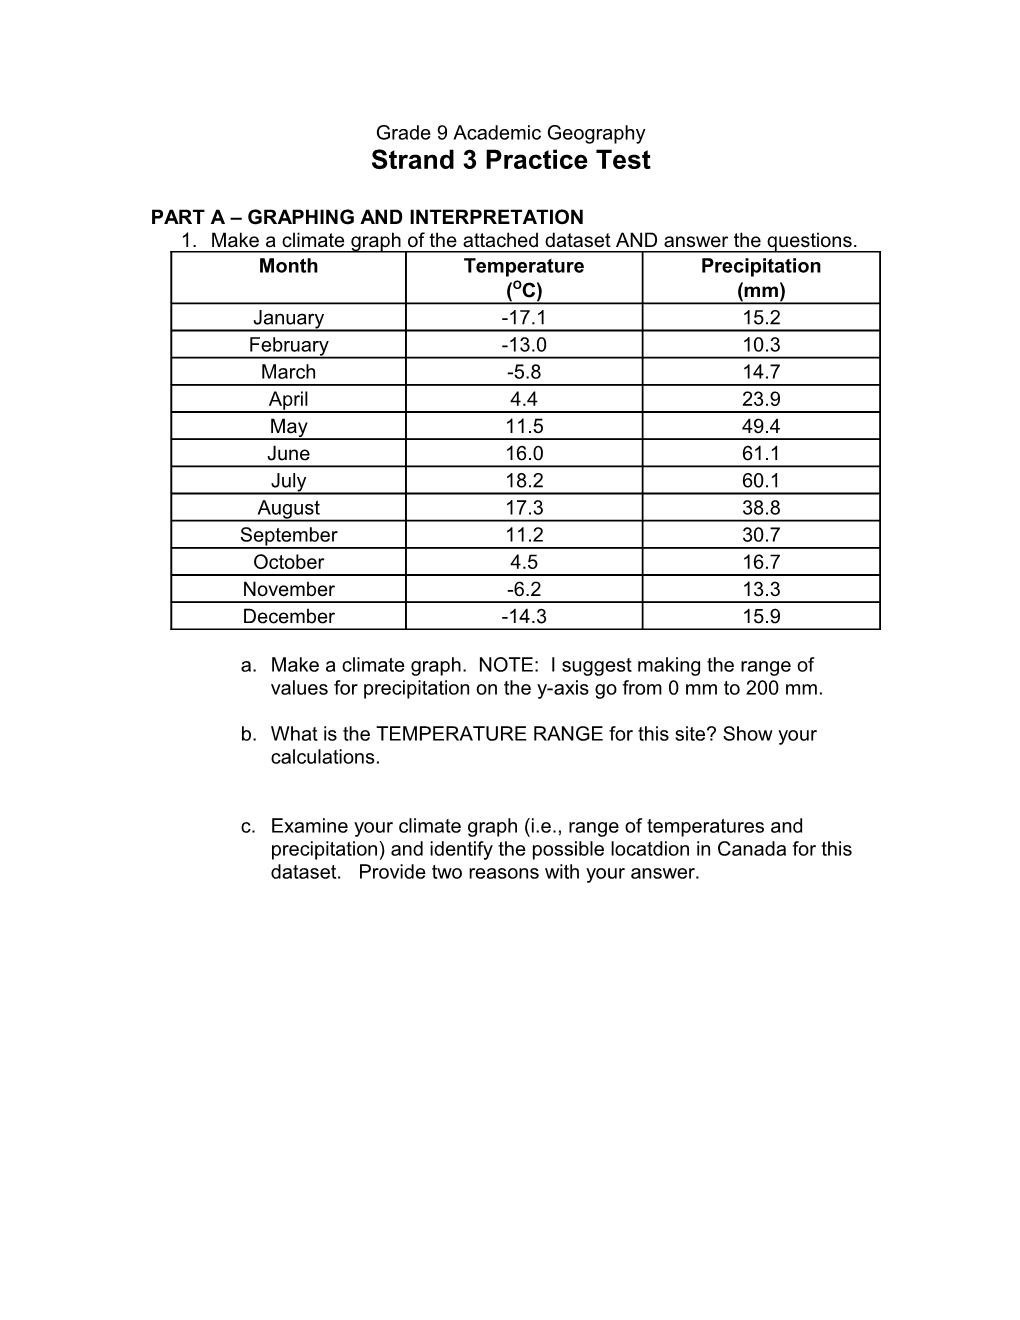
PART A – GRAPHING AND INTERPRETATION
1. Make a climate graph of the attached dataset AND answer the questions.
Month
/ Temperature(OC) /
Precipitation
(mm)January / -17.1 / 15.2
February / -13.0 / 10.3
March / -5.8 / 14.7
April / 4.4 / 23.9
May / 11.5 / 49.4
June / 16.0 / 61.1
July / 18.2 / 60.1
August / 17.3 / 38.8
September / 11.2 / 30.7
October / 4.5 / 16.7
November / -6.2 / 13.3
December / -14.3 / 15.9
a. Make a climate graph. NOTE: I suggest making the range of values for precipitation on the y-axis go from 0 mm to 200 mm.
b. What is the TEMPERATURE RANGE for this site? Show your calculations.
c. Examine your climate graph (i.e., range of temperatures and precipitation) and identify the possible locatdion in Canada for this dataset. Provide two reasons with your answer.
PART B – SHORT ANSWERS, DIAGRAMS AND INTERPRETATION
2. Using a diagram, explain how OROGRAPHIC PRECIPITATION occurs.
3. Using a diagram, explain how the movement of tectonic plates occurs.
4. German scientists Wegener proposed the theory of Continental Drift. Wegener suggested (1) the Earth’s land masses were in motion and (2) the Earth’s continents were once combined as one Pangaea. Wegener based his theory on four observations. What were Wegener’s four observations?
5. How does latitude impact climate? Explain. You may use a diagram to support your written description
6. Using a diagram, explain the process of lake effect snow and answer the question “Although Watertown, New York is further south than Kingston, Watertown receives more snow. Why?”
PART A – GRAPHING AND INTERPRETATION
1. Make a climograph of the attached dataset AND answer the questions.
Month
/ Temperature(OC) /
Precipitation
(mm)January / -17.1 / 15.2
February / -13.0 / 10.3
March / -5.8 / 14.7
April / 4.4 / 23.9
May / 11.5 / 49.4
June / 16.0 / 61.1
July / 18.2 / 60.1
August / 17.3 / 38.8
September / 11.2 / 30.7
October / 4.5 / 16.7
November / -6.2 / 13.3
December / -14.3 / 15.9
a. Make a climate graph.
b. What is the TEMPERATURE RANGE for this site? Show your calculations.
Range = 18.2 + (-17.1) = 37.3
The temperature range is 37.3OC
c. Examine your climate graph (i.e., range of temperatures and precipitation) and identify the possible location in Canada for this dataset. Provide two reasons with your answer.
Prairie
· Wide range of temperatures (very hot and very cold). Thus, no water bodies nearby to moderate temperatures
· Precipitation is little. Thus, dry with no rainfall. Leeward side of mountains, no waterbody nearby…thus, no precipitation.
PART B – SHORT ANSWERS, DIAGRAMS AND INTERPRETATION
2. Using a diagram, explain how OROGRAPHIC PRECIPITATION occurs.
Orographic precipitation results when warm moist air moving across the ocean is forced to rise by large mountains. As the air rises, it cools. Why? A higher elevation results in cooler temperatures.
Cold air cannot hold as much moisture as warm air. As the air cools, the water vapour in the air condenses and water droplets form. Clouds forms and precipitation (rain or snow) occurs on the windward side of the mountain (see diagram). The air is now dry. It rises over top the mountain. As the air moves back down the mountain, it collects moisture from the ground via evaporation. This side of the mountain is called the leeward side. It receives very little precipitation.
3. Using a diagram, explain how the movement of tectonic plates occurs.
4. German scientists Wegener proposed the theory of Continental Drift. Wegener suggested (1) the Earth’s land masses were in motion and (2) the Earth’s continents were once combined as one Pangaea. Wegener based his theory on four observations. What were Wegener’s four observations?
· Jigsaw fit of South America and Africa
· Fossils of same plants and animals on both continents
· Mountains of similar age and rock structure on both sides of the Atlantic Ocean
· Ice sheets that covered parts of Earth that are warm today (e.g., India)
5. How does latitude impact climate? Explain. You may use a diagram to support your written description
· The further from the equator your go north or south, the colder it becomes. Areas near the equator are warm because the sun’s rays strike the earth in a very concentrated area. Whereas at the colder poles, the sun’s rays strike the earth on an angle and their impact is spread out over a larger area (i.e., the warming impact is less intense)
6. Using a diagram, explain the process of lake effect snow and answer the question “Although Watertown, New York is further south than Kingston, Watertown receives more snow. Why?”
· The air is warmed while moving across Lake Ontario. Warm air can hold more moisture, so evaporation occurs. As the warm air moves over the colder land, the air encounters a cold air mass. The warm air rises, cools, becomes more dense and the water vapours condense. The cold air cannot hold the moisture, and snow fall occurs. The type of precipitation is Cyclonic Precipitation.