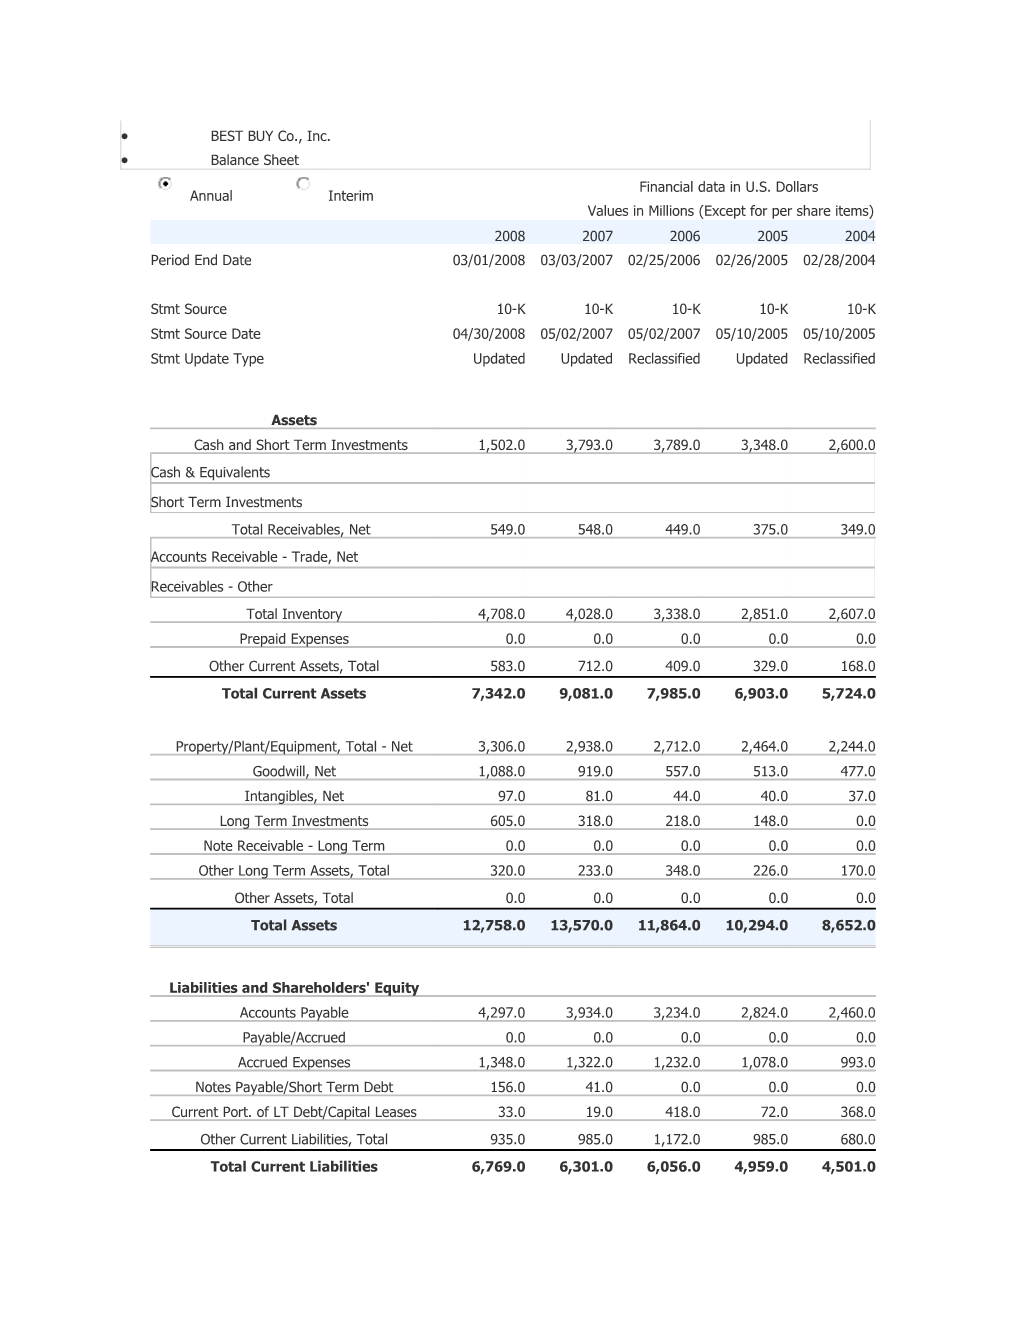
- BEST BUY Co., Inc.
- Balance Sheet
Annual / Interim
/ Financial data in U.S. Dollars
Values in Millions (Except for per share items)
2008 / 2007 / 2006 / 2005 / 2004
Period End Date / 03/01/2008 / 03/03/2007 / 02/25/2006 / 02/26/2005 / 02/28/2004
Stmt Source / 10-K / 10-K / 10-K / 10-K / 10-K
Stmt Source Date / 04/30/2008 / 05/02/2007 / 05/02/2007 / 05/10/2005 / 05/10/2005
Stmt Update Type / Updated / Updated / Reclassified / Updated / Reclassified
Assets
Cash and Short Term Investments / 1,502.0 / 3,793.0 / 3,789.0 / 3,348.0 / 2,600.0
Cash & Equivalents / 1,438.0 / 1,205.0 / 748.0 / 354.0 / 245.0
Short Term Investments / 64.0 / 2,588.0 / 3,041.0 / 2,994.0 / 2,355.0
Total Receivables, Net / 549.0 / 548.0 / 449.0 / 375.0 / 349.0
Accounts Receivable - Trade, Net / 549.0 / 548.0 / 449.0 / 375.0 / 343.0
Receivables - Other / 0.0 / 0.0 / 0.0 / 0.0 / 6.0
Total Inventory / 4,708.0 / 4,028.0 / 3,338.0 / 2,851.0 / 2,607.0
Prepaid Expenses / 0.0 / 0.0 / 0.0 / 0.0 / 0.0
Other Current Assets, Total / 583.0 / 712.0 / 409.0 / 329.0 / 168.0
Total Current Assets / 7,342.0 / 9,081.0 / 7,985.0 / 6,903.0 / 5,724.0
Property/Plant/Equipment, Total - Net / 3,306.0 / 2,938.0 / 2,712.0 / 2,464.0 / 2,244.0
Goodwill, Net / 1,088.0 / 919.0 / 557.0 / 513.0 / 477.0
Intangibles, Net / 97.0 / 81.0 / 44.0 / 40.0 / 37.0
Long Term Investments / 605.0 / 318.0 / 218.0 / 148.0 / 0.0
Note Receivable - Long Term / 0.0 / 0.0 / 0.0 / 0.0 / 0.0
Other Long Term Assets, Total / 320.0 / 233.0 / 348.0 / 226.0 / 170.0
Other Assets, Total / 0.0 / 0.0 / 0.0 / 0.0 / 0.0
Total Assets / 12,758.0 / 13,570.0 / 11,864.0 / 10,294.0 / 8,652.0
Liabilities and Shareholders' Equity
Accounts Payable / 4,297.0 / 3,934.0 / 3,234.0 / 2,824.0 / 2,460.0
Payable/Accrued / 0.0 / 0.0 / 0.0 / 0.0 / 0.0
Accrued Expenses / 1,348.0 / 1,322.0 / 1,232.0 / 1,078.0 / 993.0
Notes Payable/Short Term Debt / 156.0 / 41.0 / 0.0 / 0.0 / 0.0
Current Port. of LT Debt/Capital Leases / 33.0 / 19.0 / 418.0 / 72.0 / 368.0
Other Current Liabilities, Total / 935.0 / 985.0 / 1,172.0 / 985.0 / 680.0
Total Current Liabilities / 6,769.0 / 6,301.0 / 6,056.0 / 4,959.0 / 4,501.0
Total Long Term Debt / 627.0 / 590.0 / 178.0 / 528.0 / 482.0
Long Term Debt / 627.0 / 590.0 / 178.0 / 528.0 / 482.0
Deferred Income Tax / 0.0 / 0.0 / 0.0 / 0.0 / 0.0
Minority Interest / 40.0 / 35.0 / 0.0 / 0.0 / 0.0
Other Liabilities, Total / 838.0 / 443.0 / 373.0 / 358.0 / 247.0
Total Liabilities / 8,274.0 / 7,369.0 / 6,607.0 / 5,845.0 / 5,230.0
Redeemable Preferred Stock / 0.0 / 0.0 / 0.0 / 0.0 / 0.0
Preferred Stock - Non Redeemable, Net / 0.0 / 0.0 / 0.0 / 0.0 / 0.0
Common Stock / 41.0 / 48.0 / 49.0 / 33.0 / 32.0
Additional Paid-In Capital / 8.0 / 430.0 / 643.0 / 952.0 / 836.0
Retained Earnings (Accumulated Deficit) / 3,933.0 / 5,507.0 / 4,304.0 / 3,315.0 / 2,468.0
Other Equity, Total / 502.0 / 216.0 / 261.0 / 149.0 / 86.0
Total Equity / 4,484.0 / 6,201.0 / 5,257.0 / 4,449.0 / 3,422.0
Total Liabilities & Shareholders’ Equity / 12,758.0 / 13,570.0 / 11,864.0 / 10,294.0 / 8,652.0
Total Common Shares Outstanding / 410.58 / 480.66 / 485.1 / 492.51 / 486.97
Total Preferred Shares Outstanding / 0.0 / 0.0 / 0.0 / 0.0 / 0.0
Best Buy Co., Inc. Income Statement
Annual / Interim/ Financial data in U.S. Dollars
Values in Millions (Except for per share items)
2008 / 2007 / 2006 / 2005 / 2004
Period End Date / 03/01/2008 / 03/03/2007 / 02/25/2006 / 02/26/2005 / 02/28/2004
Period Length / 52 Weeks / 53 Weeks / 52 Weeks / 52 Weeks / 52 Weeks
Stmt Source / 10-K / 10-K / 10-K / 10-K / 10-K
Stmt Source Date / 04/30/2008 / 05/02/2007 / 05/10/2006 / 05/10/2005 / 05/10/2005
Stmt Update Type / Updated / Updated / Updated / Updated / Reclassified
Revenue / 40,023.0 / 35,934.0 / 30,848.0 / 27,433.0 / 24,548.0
Total Revenue / 40,023.0 / 35,934.0 / 30,848.0 / 27,433.0 / 24,548.0
Cost of Revenue, Total / 30,477.0 / 27,165.0 / 23,122.0 / 20,938.0 / 18,677.0
Gross Profit / 9,546.0 / 8,769.0 / 7,726.0 / 6,495.0 / 5,871.0
Selling/General/Administrative Expenses, Total / 7,385.0 / 6,770.0 / 6,082.0 / 5,053.0 / 4,567.0
Research & Development / 0.0 / 0.0 / 0.0 / 0.0 / 0.0
Depreciation/Amortization / 0.0 / 0.0 / 0.0 / 0.0 / 0.0
Interest Expense (Income), Net Operating / 0.0 / 0.0 / 0.0 / 0.0 / 0.0
Unusual Expense (Income) / 0.0 / 0.0 / 0.0 / 0.0 / 0.0
Other Operating Expenses, Total / 0.0 / 0.0 / 0.0 / 0.0 / 0.0
Operating Income / 2,161.0 / 1,999.0 / 1,644.0 / 1,442.0 / 1,304.0
Interest Income (Expense), Net Non-Operating / 67.0 / 131.0 / 77.0 / 1.0 / -8.0
Gain (Loss) on Sale of Assets / 0.0 / 0.0 / 0.0 / 0.0 / 0.0
Other, Net / 0.0 / 0.0 / 0.0 / 0.0 / 0.0
Income Before Tax / 2,228.0 / 2,130.0 / 1,721.0 / 1,443.0 / 1,296.0
Income Tax - Total / 815.0 / 752.0 / 581.0 / 509.0 / 496.0
Income After Tax / 1,413.0 / 1,378.0 / 1,140.0 / 934.0 / 800.0
Minority Interest / -3.0 / -1.0 / 0.0 / 0.0 / 0.0
Equity In Affiliates / -3.0 / 0.0 / 0.0 / 0.0 / 0.0
U.S. GAAP Adjustment / 0.0 / 0.0 / 0.0 / 0.0 / 0.0
Net Income Before Extra. Items / 1,407.0 / 1,377.0 / 1,140.0 / 934.0 / 800.0
Total Extraordinary Items / 0.0 / 0.0 / 0.0 / 50.0 / -95.0
Discontinued Operations / 0.0 / 0.0 / 0.0 / 50.0 / -95.0
Net Income / 1,407.0 / 1,377.0 / 1,140.0 / 984.0 / 705.0
Total Adjustments to Net Income / 0.0 / 0.0 / 0.0 / 0.0 / 0.0
Preferred Dividends / 0.0 / 0.0 / 0.0 / 0.0 / 0.0
General Partners' Distributions / 0.0 / 0.0 / 0.0 / 0.0 / 0.0
Basic Weighted Average Shares / 439.9 / 482.1 / 490.3 / 488.85 / 484.95
Basic EPS Excluding Extraordinary Items / 3.2 / 2.86 / 2.33 / 1.91 / 1.65
Basic EPS Including Extraordinary Items / 3.2 / 2.86 / 2.33 / 2.01 / 1.45
Diluted Weighted Average Shares / 452.9 / 496.2 / 504.8 / 504.9 / 500.85
Diluted EPS Excluding Extrordinary Items / 3.12 / 2.79 / 2.27 / 1.86 / 1.61
Diluted EPS Including Extraordinary Items / 3.12 / 2.79 / 2.27 / 1.96 / 1.42
Dividends per Share - Common Stock Primary Issue / 0.46 / 0.36 / 0.31 / 0.28 / 0.27
Gross Dividends - Common Stock / 204.0 / 174.0 / 151.0 / 137.0 / 130.0
Interest Expense, Supplemental / 62.0 / 31.0 / 30.0 / 44.0 / 33.0
Depreciation, Supplemental / 580.0 / 505.0 / 453.0 / 455.0 / 385.0
Normalized EBITDA / 2,741.0 / 2,508.0 / 2,100.0 / 1,901.0 / 1,689.0
Normalized EBIT / 2,161.0 / 1,999.0 / 1,644.0 / 1,442.0 / 1,304.0
Normalized Income Before Tax / 2,228.0 / 2,130.0 / 1,721.0 / 1,443.0 / 1,296.0
Normalized Income After Taxes / 1,413.0 / 1,378.0 / 1,140.0 / 934.0 / 800.0
Normalized Income Available to Common / 1,407.0 / 1,377.0 / 1,140.0 / 934.0 / 800.0
Basic Normalized EPS / 3.2 / 2.86 / 2.33 / 1.91 / 1.65
Diluted Normalized EPS / 3.12 / 2.79 / 2.27 / 1.86 / 1.61
Amortization of Intangibles / 0.0 / 4.0 / 3.0 / 4.0 / 0.0
Best Buy Cash Flow Statement
Annual / Interim/ Financial data in U.S. Dollars
Values in Millions (Except for per share items)
2008 / 2007 / 2006 / 2005 / 2004
Period End Date / 03/01/2008 / 03/03/2007 / 02/25/2006 / 02/26/2005 / 02/28/2004
Period Length / 52 Weeks / 53 Weeks / 52 Weeks / 52 Weeks / 52 Weeks
Stmt Source / 10-K / 10-K / 10-K / 10-K / 10-K
Stmt Source Date / 04/30/2008 / 05/02/2007 / 05/02/2007 / 05/10/2006 / 05/10/2006
Stmt Update Type / Updated / Updated / Restated / Restated / Reclassified
Net Income/Starting Line / 1,407.0 / 1,377.0 / 1,140.0 / 984.0 / 705.0
Depreciation/Depletion / 580.0 / 509.0 / 456.0 / 459.0 / 385.0
Amortization / 0.0 / 0.0 / 0.0 / 0.0 / 0.0
Deferred Taxes / 74.0 / 82.0 / -151.0 / -28.0 / -14.0
Non-Cash Items / 78.0 / 92.0 / 78.0 / -5.0 / 81.0
Discontinued Operations / 0.0 / 0.0 / 0.0 / -50.0 / 43.0
Unusual Items / 0.0 / 32.0 / 4.0 / 22.0 / 22.0
Other Non-Cash Items / 78.0 / 60.0 / 74.0 / 23.0 / 16.0
Changes in Working Capital / -114.0 / -298.0 / 217.0 / 571.0 / 178.0
Accounts Receivable / 12.0 / -70.0 / -43.0 / -30.0 / -27.0
Inventories / -562.0 / -550.0 / -457.0 / -240.0 / -507.0
Other Assets / 42.0 / -47.0 / -11.0 / -50.0 / -7.0
Accounts Payable / 221.0 / 320.0 / 385.0 / 347.0 / 272.0
Taxes Payable / 99.0 / -136.0 / 178.0 / 301.0 / 197.0
Other Liabilities / 74.0 / 185.0 / 165.0 / 243.0 / 250.0
Cash from Operating Activities / 2,025.0 / 1,762.0 / 1,740.0 / 1,981.0 / 1,335.0
Capital Expenditures / -797.0 / -733.0 / -648.0 / -502.0 / -545.0
Purchase of Fixed Assets / -797.0 / -733.0 / -648.0 / -502.0 / -545.0
Other Investing Cash Flow Items, Total / 2,261.0 / -47.0 / -106.0 / -920.0 / -832.0
Acquisition of Business / -89.0 / -421.0 / 0.0 / 0.0 / 0.0
Sale/Maturity of Investment / 10,935.0 / 4,910.0 / 4,187.0 / 7,730.0 / 2,175.0
Purchase of Investments / -8,501.0 / -4,541.0 / -4,319.0 / -8,517.0 / -2,989.0
Other Investing Cash Flow / -84.0 / 5.0 / 26.0 / -133.0 / -18.0
Cash from Investing Activities / 1,464.0 / -780.0 / -754.0 / -1,422.0 / -1,377.0
Financing Cash Flow Items / 8.0 / 31.0 / 45.0 / -7.0 / 46.0
Other Financing Cash Flow / 8.0 / 31.0 / 45.0 / -7.0 / 46.0
Total Cash Dividends Paid / -204.0 / -174.0 / -151.0 / -137.0 / -130.0
Issuance (Retirement) of Stock, Net / -3,315.0 / -382.0 / -480.0 / 56.0 / 14.0
Issuance (Retirement) of Debt, Net / 133.0 / 12.0 / -33.0 / -371.0 / -17.0
Cash from Financing Activities / -3,378.0 / -513.0 / -619.0 / -459.0 / -87.0
Foreign Exchange Effects / 122.0 / -12.0 / 27.0 / 9.0 / 1.0
Net Change in Cash / 233.0 / 457.0 / 394.0 / 109.0 / -128.0
Net Cash - Beginning Balance / 1,205.0 / 748.0 / 354.0 / 245.0 / 373.0
Net Cash - Ending Balance / 1,438.0 / 1,205.0 / 748.0 / 354.0 / 245.0
Best Buy Co., Inc
10 Year Summary / Financial data in U.S. Dollars
Values in Millions (Except for per share items)
Income Statement - 10 Year Summary (in Millions)
Sales / EBIT / Depreciation / Total Net Income / EPS / Tax Rate (%)03/08 / 40,023.0 / 2,228.0 / 580.0 / 1,407.0 / 3.12 / 36.58
03/07 / 35,934.0 / 2,130.0 / 509.0 / 1,377.0 / 2.79 / 35.31
02/06 / 30,848.0 / 1,721.0 / 456.0 / 1,140.0 / 2.27 / 33.76
02/05 / 27,433.0 / 1,443.0 / 459.0 / 934.0 / 1.86 / 35.27
02/04 / 24,548.0 / 1,296.0 / 385.0 / 800.0 / 1.61 / 38.27
03/03 / 20,943.0 / 1,014.0 / 310.0 / 622.0 / 1.27 / 38.66
03/02 / 17,711.0 / 926.0 / 245.0 / 570.0 / 1.18 / 38.44
03/01 / 15,189.0 / 649.0 / 165.0 / 401.0 / 0.84 / 38.21
02/00 / 12,494.02 / 562.57 / 108.0 / 347.07 / 0.73 / 38.31
02/99 / 10,064.65 / 351.68 / 73.63 / 216.28 / 0.46 / 38.5
Balance Sheet - 10 Year Summary (in Millions)
Current Assets / Current Liabilities / Long Term Debt / Shares Outstanding03/08 / 12,758.0 / 8,274.0 / 627.0 / 410.6 Mil
03/07 / 13,570.0 / 7,369.0 / 590.0 / 480.7 Mil
02/06 / 11,864.0 / 6,607.0 / 178.0 / 485.1 Mil
02/05 / 10,294.0 / 5,845.0 / 528.0 / 492.5 Mil
02/04 / 8,652.0 / 5,230.0 / 482.0 / 487.0 Mil
03/03 / 7,694.0 / 4,964.0 / 828.0 / 482.9 Mil
03/02 / 7,367.0 / 4,846.0 / 808.0 / 478.7 Mil
03/01 / 4,840.0 / 3,018.0 / 181.0 / 468.3 Mil
02/00 / 2,995.34 / 1,899.36 / 14.86 / 450.9 Mil
02/99 / 2,531.62 / 1,497.68 / 30.51 / 458.1 Mil