Geography 204
Designing a Simple Biological Community:
Community Matrix Example - Producers
It is suggested that you calculate producers, first, then primary consumers, then secondary consumers, then tertiary consumers, then decomposers. At this point you are not finished as the decomposers add nitrogen to your environment you’ll have to do some more calculations adding some more producers then primary consumers etc. However, you are not expected to do more that three iterations (or sets of calculations) for the whole community.
This example just uses some randomly selected species. The number a species is probably a little low. This is done to simplify the example. Assume for this example that only 150 units of nitrogen are initially available in the environment.
The first issue your group will have to resolve is how many individuals (the population) for each species to have. It is VERY IMPORTANT to consider bothnitrogen use and interspecific relationships your plants might have with the rest of the community. Remember, nitrogen availability will constrain the amount of producer biomass in your community!
While your primary goal is to MAXIMZE DIVERSITY you should try to maintain a large number of producers that are efficient at using nitrogen to produce biomass since biomass is food for other trophic levels.
To figure out this efficiency, divide the amount of biomass produced by one individual by the nitrogen used up by that individual. For example, for one individual short grass plant, 6 units of biomass divided by .1 units of nitrogen result in a ratio of 60 unit of biomass per unit of nitrogen for this species (see species table on page 5 of the lab assignment). For Wild Rose the value is 20, for Juniper Trees the value is 80, for Oak Trees the value is 65. Obviously, you get more out of nitrogen with Junipers than Roses (at least in this lab).
Now what mix to go for in terms of numbers of individuals per producer species? This is one of the most important issues to consider in this lab!Go for nitrogen efficiency but also remember that some consumers are adapted to eating only certain types of producers and that some producers have mutual or commensal relationships with other species.
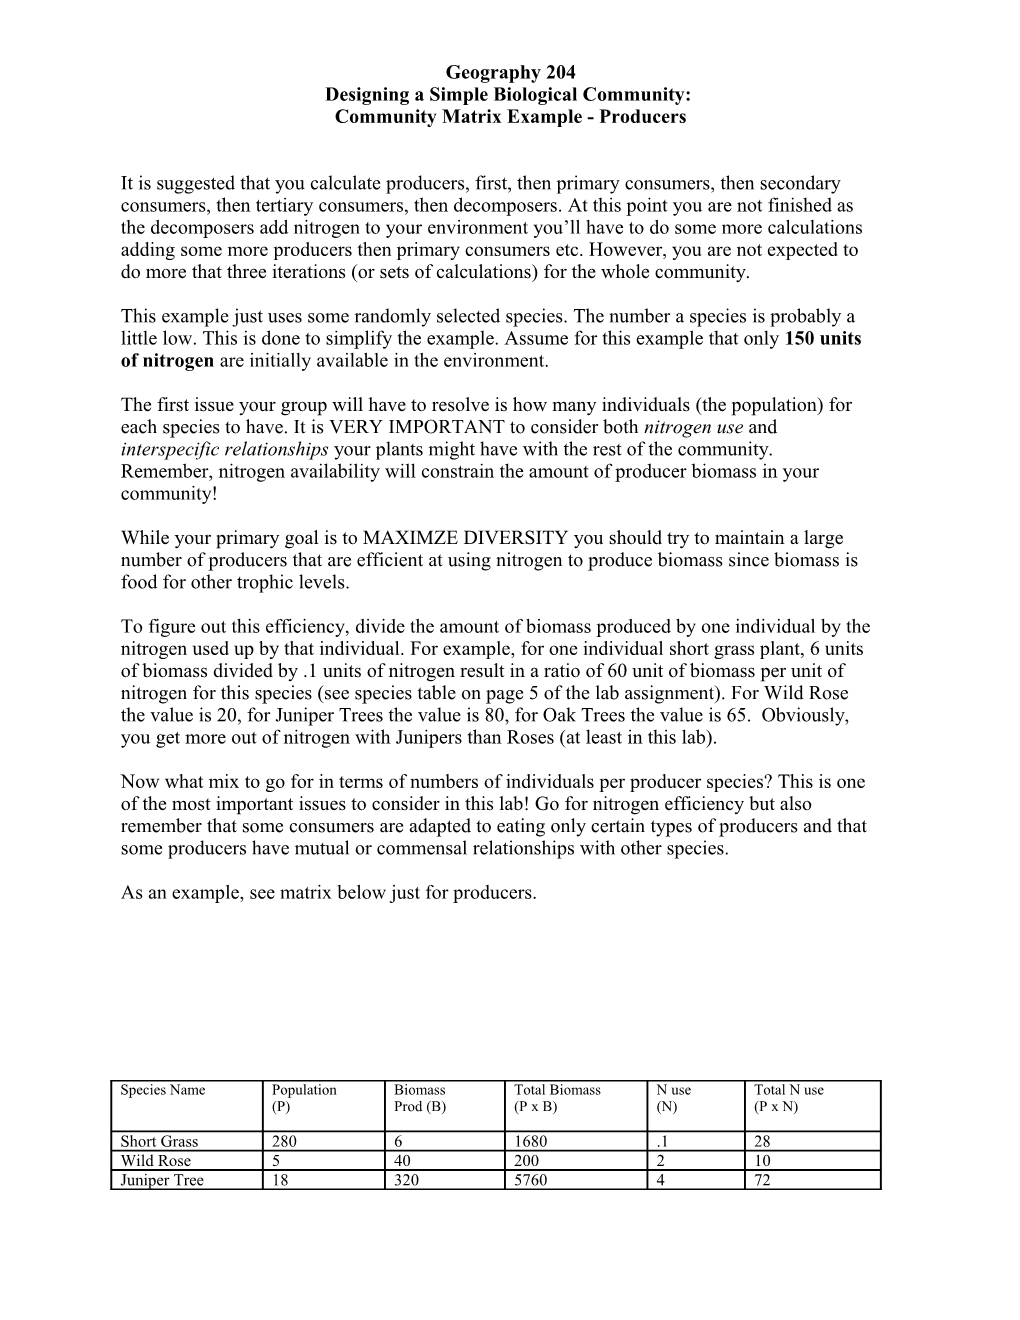
As an example, see matrix below just for producers.
Species Name / Population (P) / Biomass Prod (B) / Total Biomass (P x B) / N use (N) / Total N use(P x N)
Short Grass / 280 / 6 / 1680 / .1 / 28
Wild Rose / 5 / 40 / 200 / 2 / 10
Juniper Tree / 18 / 320 / 5760 / 4 / 72
Oak Tree / 1 / 2600 / 2600 / 40 / 40
Producers / 10,240 / 150
Note that in this example there is a good mix of grasses and trees which is important for primary consumers like squirrels, rabbits, antelope and grasshoppers. Be sure however, to consider only those consumers that can exist in your environment.