ATMOSPHERIC AND OCEANIC SCIENCE LETTERS, 2011, VOL. 4, NO. 1, 4146
A Preliminary Analysis of the Relationship between Precipitation
Variation Trends and Altitude in China
YANG Qing1, 2, MA Zhu-Guo1, and CHEN Liang1, 2
1 Key Laboratory of Regional Climate-Environment Research for Temperate East Asia (RCE-TEA), Institute of Atmospheric Physics,
Chinese Academy of Sciences, Beijing 100029, China
2 Graduate University of the Chinese Academy of Sciences, Beijing 100049, China
Received 16 November 2010; revised 6 December 2010; accepted 14 December 2010; published 16 January 2011
Abstract Characteristics of the relationship between cussed the topographic effects on precipitation (Barros precipitation variation trends (PVT) and altitude were and Lettenmaier, 1994; Basist et al., 1994; Liao et al., analyzed using monthly mean precipitation data from 526 2007), few studies have analyzed the relationship between observation stations in China from 1961 to 2008. With precipitation variation trends (PVT) and topography. Ma respect to elevation, China was divided into three subre- and Fu (2007) found that the topographic effects of the gions, below 200 m, 200–1500 m, and above 1500 m. The Tibetan Plateau are likely to be related to the fact that the results showed that the correlations between annual PVT and altitude are different among the three regions. In the region below 200 m in elevation, the best relationship has a correlation coefficient of –0.19 (0.49), passing the 90%
(99.9%) significance level south (north) of 35N. However, the correlation coefficient is close to zero, and the latitude strongly governs the spatial distribution of the amplitude of annual PVT in the 200–1500-m elevation region. In most of the Tibetan Plateau, where the elevation is greater than 1500 m, there is a weak negative correlation. The Mann-Kendall method was used to test the trend of regional mean annual precipitation, which indicated that the annual mean precipitation had no obvious trend of change in China due to the reverse significant variation trends in different areas of the country. increasing trend of precipitation east of 100E shifts southward to 32.5N (along the Yangtze River) in the spatial distribution of global PVT. However, it is not clear how precipitation trends are affected by topography on a nationwide scale.
Altitude is generally accepted as the most common topographic variable used to explain spatial variations in precipitation for precipitation enhancement through orographic uplift; it should be noted that altitude explains
0–90% of the variance of mean annual precipitation in
Switzerland, depending on the region (Sevruk, 1997). The increasing rate of precipitation with height varies from approximately 4.5 mm m1 in the northwest to almost zero in the southeast of Great Britain (Brunsdon et al., 2001).
The effect of altitude, however, is not always positive. Lu et al. (2008) discussed the negative correlation between summer precipitation and altitude in China and found that the correlation is becoming stronger with increased global warming.
A primary objective of this study is to preliminarily discuss the relationship between PVT and altitude on a nationwide scale. A larger number of topographic variables, such as orientation, slope, and exposure, were analyzed to identify the future effect of topography on PVT.
This study reviews the data and methods in section 2 and presents the results in section 3. Study conclusions and a discussion are presented in section 4.
Keywords: precipitation tendency rate, topographic effect, altitude, correlation
Citation: Yang, Q., Z.-G. Ma, and L. Chen, 2011: A preliminary analysis of the relationship between precipitation variation trends and altitude in China, Atmos. Oceanic Sci.
Lett., 4, 41–46.
1 Introduction
In addition to changes in temperature, global precipitation patterns, and the frequencies of severe droughts and floods will be seriously affected by global warming. The precipitation variation trend in China has been analyzed against this background of large-scale warming (Zhai et al., 2005; Gemmer et al., 2004). Wang et al. (2006) found 2 Data and analysis methods that the overall decreasing precipitation trend in China was comparable to global trends, but regional variation
2.1 Data patterns were opposite those of global patterns in that precipitation increased in mid- and high-latitude regions and decreased in tropical and semitropical regions.
It has long been known that topography strongly affects the spatial patterns of precipitation by altering both the local wind patterns and condensation of precipitable water (Bonacina, 1945). While many studies have dis-
The data used in this study were monthly Chinese precipitation data from 1951 to 2009, which consists of measurements from 756 observation stations. Some stations are seasonal observation stations (e.g., Tianshan), where precipitation is measured only from June to September, and some stations are ordinary climatological stations, where precipitation is not measured. To maximize data quality, the seasonal stations, ordinary climatological stations, and observation stations with any
Corresponding author: MA Zhu-Guo, mazg@tea.ac.cn 42 ATMOSPHERIC AND OCEANIC SCIENCE LETTERS VOL. 4
missing data (a month without measured precipitation
The precipitation variation trend was detected by the data) were removed. Ultimately, data collected from 1961 Mann-Kendall (M-K) method (Sneyers, 1990; Fu and to 2008 from 526 stations were analyzed.
Wang, 1992) and was significant (passing the 95% significance level) when the absolute value of the M-K test was greater than 1.96. A positive value indicates an increasing trend, and a negative value indicates a decreasing trend. Meanwhile, an abrupt change in precipitation times series was detected by both the M-K test and the running t-test to prevent the false detection of abrupt variations
(Fu and Wang, 1992).
2.2 Methods
Simple linear regression was used to calculate the precipitation tendency rate,
Xt = a0 + a1t , (1)
here, t is time from 1961 to 2008, and Xt is the estimated monthly mean precipitation by simple linear regression.
The regression coefficient is a1=dXt/dt, and the precipitation tendency rate is b=a110, with units of mm/10 a. A positive value indicates an increasing trend, and a negative value indicates a decreasing trend. The correlation coefficient r indicates quantitatively the relationship between t and Xt.
3 Results
In this section, two subsections are analyzed. One is the relationship between annual PVT and altitude. The other is the regional mean annual precipitation for different regions.
The t-test was adopted to examine the significance of the correlation coefficient. The null hypothesis, H0, states that there is no significant correlation. The statistic t r
3.1 The relationship between annual PVT and altitude for different regions
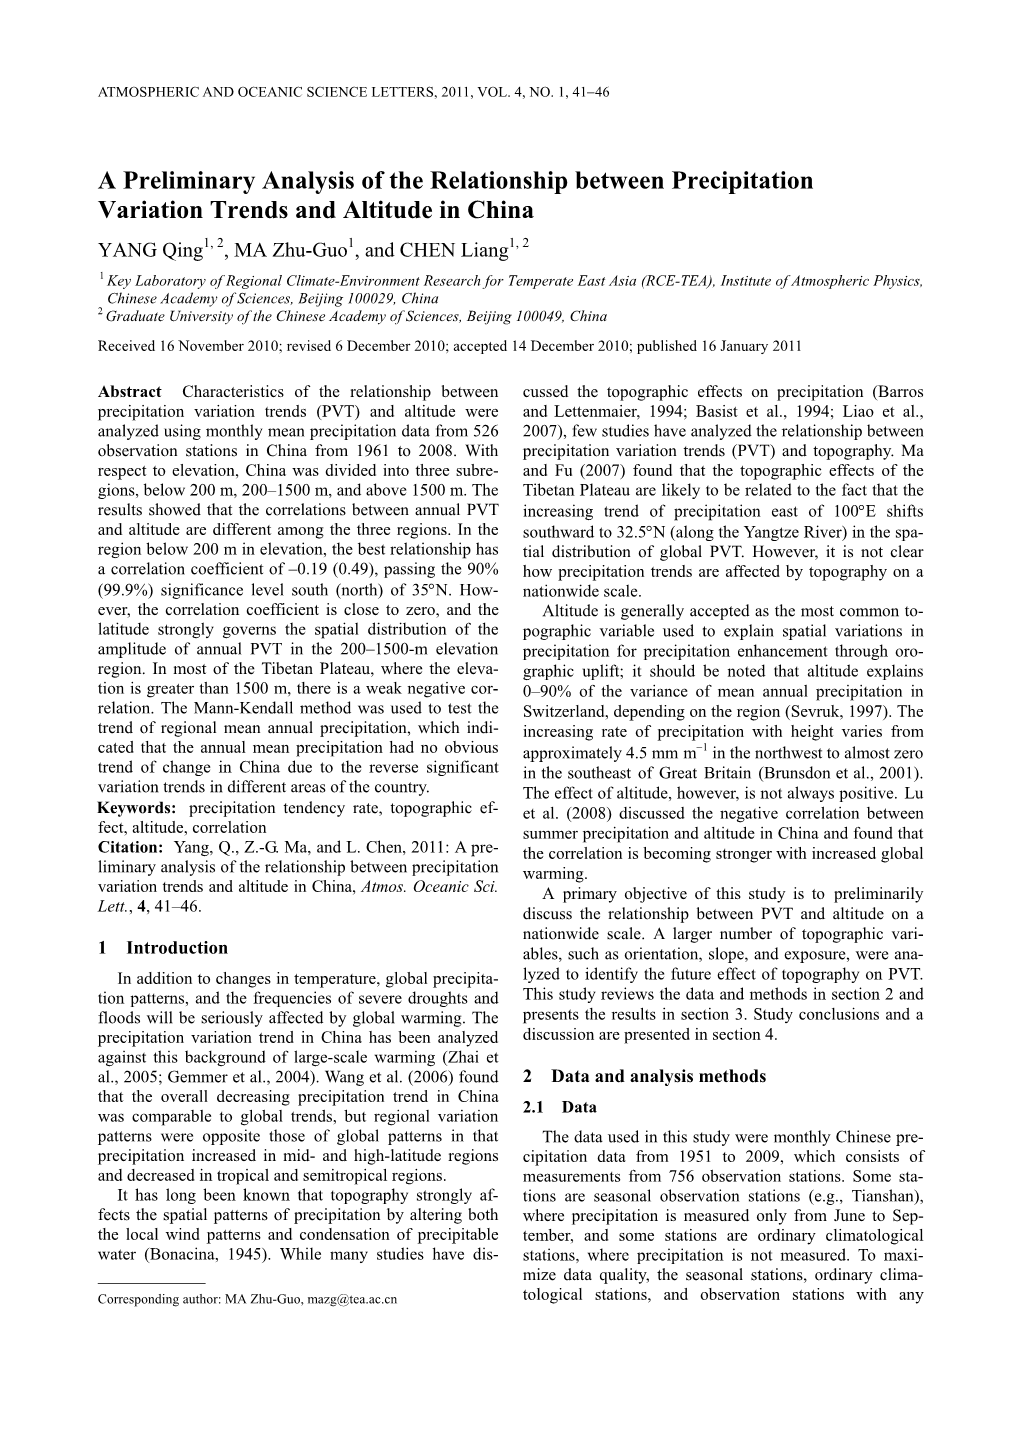
Figure 1 gives four scatter plots of annual precipitation tendency rate versus altitude for different regions. Figure
2 shows the spatial distribution of the annual precipitation tendency rate, which is required to analyze the correlation between annual PVT and altitude.
,(2) t n 2
1 r2 obeys the distribution of t with the degree of freedom
V=n–2. Here, n is the length of times series, and r is the correlation coefficient in a simple linear regression mentioned above. When the significance level is α, ta is the critical value of t-test. The null hypothesis is refuted if
|t| |ta|, otherwise, it is accepted.
3.1.1 Nationwide characteristics
Figure 1a shows an approximately symmetrical distri-
Figure 1 Scatter plots of the annual precipitation tendency rate (abscissa) versus altitude (ordinate) in different regions. (a): 0–5000 m. The two dashed lines are 200-m and 1500-m height lines; (b): 0–200 m. The two dot lines give the changes in average values of negative and positive points per 10 m along with altitude, respectively, of which the two dashed lines are trend lines; (c): 200–1500 m. The two dashed lines refer to –12 and 12;
(d): 1500–5000 m. The two dot lines give the changes in average values of negative and positive points per 100 m along with altitude, respectively, of which the two dashed lines are trend lines. NO. 1 YANG ET AL.: ANALYSIS OF THE RELATIONSHIP BETWEEN PVT AND ALTITUDE IN CHINA 43
bution of the annual precipitation tendency rates of 526 Two dot lines give the change in average values of negastations with altitudes ranging from 0 m to 5000 m. The numbers and absolute values of positive and negative value points were almost equal, which is consistent with the conclusion that there is no obvious variation trend in mean annual precipitation (Zhai et al., 2005). Relative to altitude, the observation station density is 10.2/10 m below 200 m, 1.7/10 m from 200 m to 1500 m, and 0.3/10 m above 1500 m. A series was composed of the number of observation stations every 20 m (e.g., the number is 39 below 20 m, 28 from 20 to 40 m, and 27 from 40 to 60 m).
The result of a 100-m running t-test demonstrated that
200 m is a jump point, passing the 99.9% significance level. Although there were no jump points at 1500 m, the 1500-m contour line maximized the difference in distribution patterns between above (Fig. 1d) and below (Fig. 1c) this elevation. In Fig. 1a, 200 m and 1500 m are two possible lines of demarcation. In Fig. 2, the 200-m and 1500-m contour lines are approximate dividing lines south of 35N that divide the spatial distribution of annual precipitation tendency rates into a positive-negative-positive pattern from east to west. The 1500-m topographic contour line was used to outline the area of the Tibetan
Plateau (Zhao et al., 2007). Therefore, it is feasible that the 200-m and 1500-m contour lines could be used to divide China into three subregions of elevation, below
200 m, from 200 m to 1500 m, and above 1500 m, which is different from the generic demarcations of climate regions according to precipitation and temperature (Qin et al., 2005; Qin and Qian, 2006) or dry/wet trend (Wang et al., 2004) in China. The following analyses are based on this regionalization. tive and positive points per 10 m along with altitude. As shown by the two dashed lines, which are trend lines of the two dot lines, the absolute values of annual precipitation tendency rates are decreasing with increasing altitude.
As shown in Fig. 2, the region below 200 m includes southern China, the middle and lower reaches of the Yangtze River, the Yangtze-Huaihe River basin, the southeastern of northern China, and the southern of northeastern China. In this region, most annual precipitation tendency rates are positive south of 35N and negative north of 35N.
Comparing Fig. 1b and Fig. 2, it is interesting to note that the positive value points in Fig. 1b correspond to the points distributed south of 35N in Fig. 2, and the negative value points in Fig. 1b correspond to the points located north of 35N in Fig. 2. Therefore, the 35N line divides the region into two parts. In the southern part, the correlation coefficient between annual precipitation tendency rate and altitude is –0.19, passing the 90% significance level, which means that with increasing altitude, the annual precipitation increasing trend is declining in the southern part. However, the correlation coefficient is 0.49, passing the 99.9% significance level in the northern part, meaning that the annual precipitation decreasing trend is declining with altitude in the northern part. Therefore, below 200 m, variations in annual precipitation trends in the southern and northern parts with altitude are reversed.
3.1.3 Region of altitude from 200 m to 1500 m
Figure 1c gives a scatter plot from 200 m to 1500 m. In this region, in principle, the absolute values of annual precipitation tendency rates do not vary with increasing altitude. There are 85 and 140 positive and negative value points, respectively, which means that the variation in decreasing trends in precipitation is dominant in this region.
3.1.2 Region of altitude below 200 m
The range of altitude in Fig. 1b is 0–200 m. Positive and negative points are distributed symmetrically, and the symmetry is more regular than in Fig. 1a. The 200-m region is divided into 20 equal portions with units of 10 m.
Figure 2 The spatial distribution of the annual precipitation tendency rate b (mm/10 a). The black solid lines are 200-m and 1500-m contour lines; o,
+, and □ represent the points below 200 m, 200–1500 m, and above 1500 m, respectively. The blue (o, +, and □) representing b is positive, and the red
(o, +, and □) is negative. The point for which b ≤ –12 in the area of elevation from 200 m to 1500 m is highlighted in yellow. 44 ATMOSPHERIC AND OCEANIC SCIENCE LETTERS VOL. 4
In contrast to Fig. 2, the negative value points show a parts, shown in Figs. 3a and 3d, respectively. In the region southwest-northeast belt distribution, extending from of elevation from 200 m to 1500 m, the regional average southwestern China to northeastern China, especially between the 200-m and 1500-m contour lines in southern
China. The majority of positive value points are distributed centrally in the western of northwestern China, which is consistent with the results of Shi et al. (2003). As presented in Fig. 1c, the ranges of positive and negative points are –25–0 mm/10 a and 0–12 mm/10 a, respectively. The decreasing trend of precipitation is more evident. The point that negative values range from –25 to
–12 mm/10 a, to the left side of the left-side dashed line in
Fig. 1c, are marked as yellow plus signs in Fig. 2. Figure
2 shows a large number of yellow points scattered south of 40N in the southwest-northeast belt area. In the belt area, the amplitude of annual precipitation decreasing in the mid- and low-latitude areas is larger than in the high-latitude area. In addition, the amplitude of the increasing trend in the western part of northwestern China is almost equivalent to the decreasing trend in northern
China and northeastern China. Therefore, latitude could be an important factor governing the spatial distribution of the amplitude of annual PVT that will need to be analyzed in the future. time series of the belt area mentioned above and the western part of northwestern China are given in Figs. 3b and 3e, respectively. Figures 3c and 3f display the time series of negative value points in the eastern part of the Tibetan Plateau and positive value points in the rest of the Tibetan Plateau.
The Mann-Kendall method was used to test the variation trend. The absolute values of the tested values of the six series were all greater than 1.96, indicating a significant decreasing trend in Figs. 3a–c and a significant increasing trend in Figs. 3d–f. A shift point was found in each series, indicated by solid arrow in Fig. 3. The shift point is 1975 in Fig. 3a, 1991 in Fig. 3b, and 1984 in Fig.
3c, while those of Figs. 3d–f centralized locate in 1980s.
It can be concluded that north of 35N and below 200 m, the southwest-northeast belt area and the eastern of the Tibetan Plateau, there exists a significant decreasing trend with different starting time points. There exists a significant increasing trend of annual precipitation, which begins in 1980s, south of 35N and below 200 m, west of Northwest China and most of the Tibetan Plateau.
However, the jump variation is only found in Fig. 3e, the western part of northwestern China, by a ten-year running t-test. As indicated by the dashed arrow, the jump variation from less rain to more rain in the western part of northwestern China occurred in 1987, which is consistent with the climate change trend from the warm-dry pattern to the warm-wet pattern (Shi et al., 2003).
3.1.4 Region of altitude above 1500 m
Two dot lines in Fig. 1d are similar to Fig. 1b, but the unit is 100 m for fewer stations. As shown by the two dashed lines, although the points with negative values are sparse, the characteristic that the absolute values of annual precipitation tendency rates are decreasing with increasing altitude is clear in the region above 1500 m. In
Fig. 2, the number of positive points is greater than the number of negative points, and the entire Tibetan Plateau area is increasing trend dominated. With the exception of the points with negative values scattered in the eastern of the Tibetan Plateau, there is a weak negative correlation between the annual precipitation increasing trend and altitude in most sections of the Tibetan Plateau.
The above analysis indicates that regional mean annual precipitation has a significant variation trend, but there is no obvious variation trend in annual mean precipitation overall in China because of reverse significant variation trends in different areas. Regionalization divided by elevation is effective in discussing regional precipitation variation.
4 Discussion and conclusions
The above analysis shows that the correlation between the annual precipitation tendency and altitude is different
This study provides a preliminary analysis of the relain the three different regions. In addition, latitude influ- tionship between annual PVT and altitude. Some concluences the positive-negative distribution of the annual precipitation tendency rate in the region below 200 m and variation amplitude of annual precipitation tendency rate in the region of elevation from 200 m to 1500 m. sions are presented.
First, it is an effective method to divide China into three subregions by contour lines of 200 m and 1500 m.
The 200-m and 1500-m contour lines can approximately serve as dividing lines to distinguish the spatial distribution of annual precipitation tendency rates into a positive-negative-positive pattern from east to west, south of 35N.
Second, the relationships between annual precipitation variation trends and altitude are distinctly different in the three regions analyzed. In the region of elevation below
200 m, the positive (negative) value points are centrally distributed south (north) of 35N with a correlation coefficient of –0.19 (0.49), passing the 90% (99.9%) significance level. In the region of elevation from 200 m to 1500 m, the correlation coefficient is close to zero. In most of the Tibetan Plateau of elevation above 1500 m, there is a 3.2 Regional mean annual precipitation in different regions
This section attempts to illuminate the change in regional mean annual precipitation from 1961 to 2008 in the three different regions. To avoid offsetting the positive and negative values and focus on a strong variation trend, large concentrated distributions of areas with single increasing or decreasing trends were detected, excluding some points of inverse variation trends. Along the line of 35N, the areas of altitude below 200 m were divided into northern and southern parts, and the regional average time series was calculated by the arithmetic mean of the two NO. 1 YANG ET AL.: ANALYSIS OF THE RELATIONSHIP BETWEEN PVT AND ALTITUDE IN CHINA 45
Figure 3 The regional mean annual precipitation and linear trend (dashed line) for 1961–2008, (a) the negative points north of 35N and below 200 m, (b) the negative points in the southwest-northeast belt area between 200 m and 1500 m, (c) the negative points in the eastern part of the Tibetan
Plateau at elevations above 1500 m, (d) the positive points south of 35N and below 200 m, (e) the positive points in the western part of northwestern
China, and (f) the positive points in most of the Tibetan Plateau except for the eastern part. The solid arrow indicates a shift point in each series, as detected by the M-K test, and the dashed arrow in (e) shows a shift point, as detected by a running t-test, while the average values of the two times divided by 1987 are shown by the dot line. weak negative correlation.
The correlation provides a statistical relationship be-
Third, latitude strongly governs the spatial distribution tween annual PVT and altitude, but the internal mechaof the annual precipitation tendency rate. In the region of nism remains unclear. Basist et al. (1994) found that local elevation below 200 m, there are reverse variation trends climatic conditions strongly influence the relationship between topography and the spatial distribution of precipitation. The influence of local climate on the relationship of PVT and topography need to be discussed. The analysis of PVT and topography is useful, especially in
China, which has a complex topography. A deeper understanding of the relationship is needed in the future. south and north of 35N. In addition, the points with stronger decreasing trends are largely located south of the belt area mentioned above, and the amplitude of the increasing trend in the western part of northwestern China is almost equivalent to the decreasing trends in northern
China and northeastern China.
Finally, the regional mean annual precipitation levels in the three regions discussed above all show significant variation trends. Because of the reverse significant variation trends in the different areas, the annual mean precipitation in China shows no obvious change in trend.
Due to a lack of detailed topographic information nationwide, altitude is used as a predictor of annual PVT in this study. Diodato (2005) indicated that a geostatistical model using only elevation as auxiliary information is probably too simplistic to exhaustively represent the complexity of the spatial structure of the precipitation data, and it seems to give the most accurate interpolating result by using the topographical index as external information. Therefore, additional topographic variables, such as slope, orientation, and exposure, need to be included as predictors of annual PVT. It is a good method to reduce the range of study area for detailed topographic information.
Acknowledgements. This work is supported by of the National
Natural Science Foundation of China (Key Program, Grant No.
40830956; and Grant Nos. 40775055 and 40828004).
References
Barros, A. P., and D. P. Lettenmaier, 1994: Dynamic modeling of orographically induced precipitation, Rev. Geophys., 32(3),
A Preliminary Analysis of the Relationship Between Precipitation Variation Trends and Altitude in China