Name: ______
1. ____ Which temperature zone of Earth’s atmosphere contains the most water vapor?
(1) mesosphere (2) stratosphere (3) thermosphere (4) troposphere
2. ____ Which weather condition most directly determines wind speeds at Earth’s surface?
(1) visibility changes (3) air-pressure gradient
(2) amount of cloud cover (4) dewpoint differences
3. ____ Which statement best explains why an increase in the relative humidity of a parcel of air generally increases the chance of precipitation?
(1) The dewpoint is farther from the condensation point, causing rain.
(2) The air temperature is closer to the dewpoint, making cloud formation more likely.
(3) The amount of moisture in the air is greater, making the air heavier.
(4) The specific heat of the moist air is greater than the drier air, releasing energy.
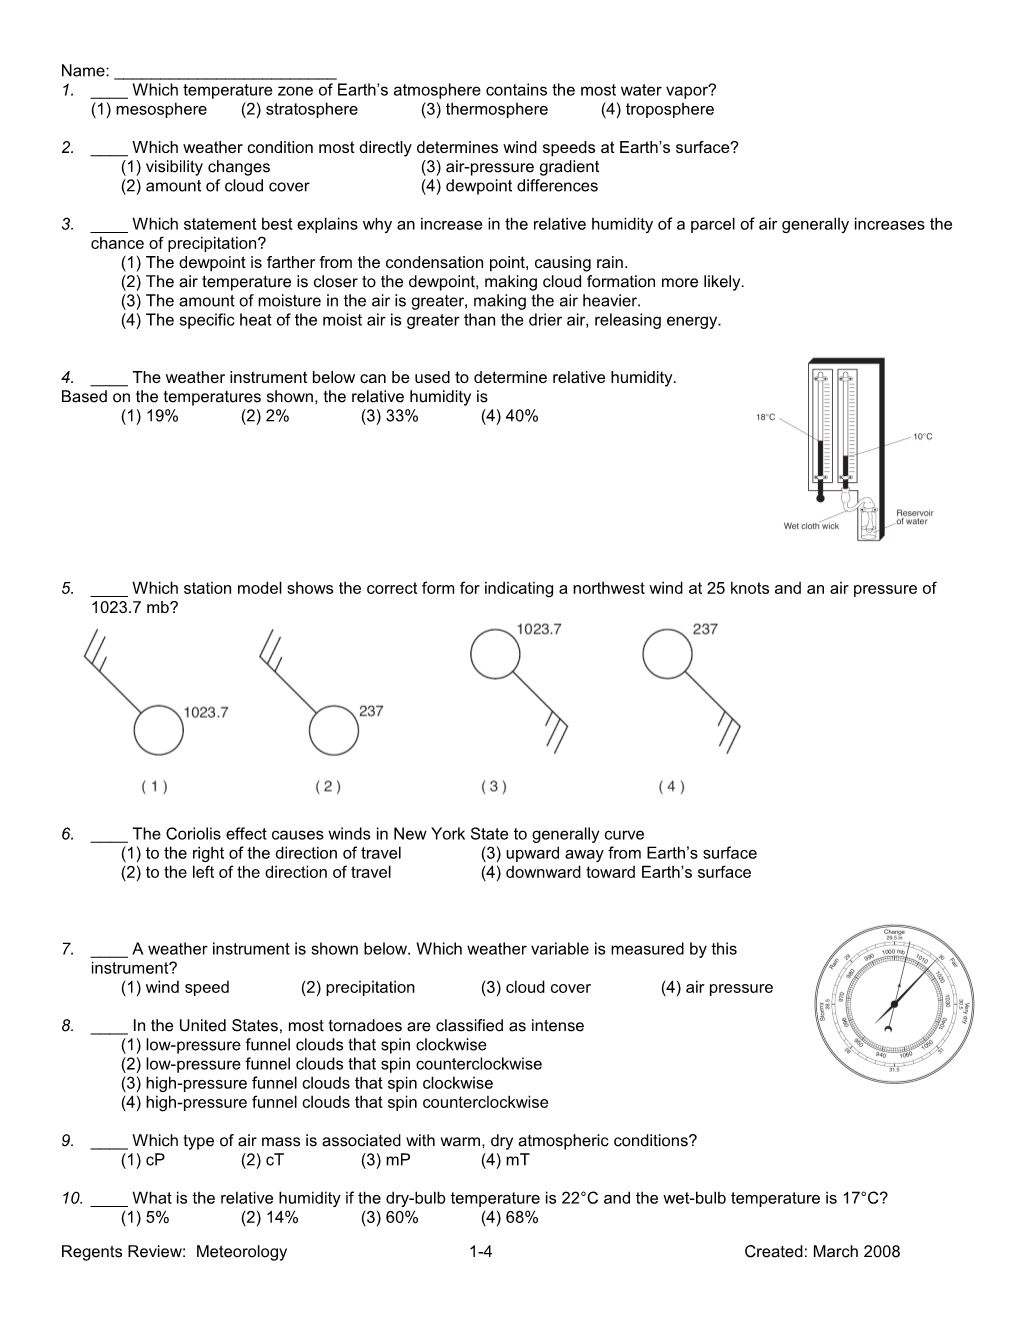
4. ____ The weather instrument below can be used to determine relative humidity.
Based on the temperatures shown, the relative humidity is
(1) 19% (2) 2% (3) 33% (4) 40%
5. ____ Which station model shows the correct form for indicating a northwest wind at 25 knots and an air pressure of 1023.7 mb?
6. ____ The Coriolis effect causes winds in New York State to generally curve
(1) to the right of the direction of travel (3) upward away from Earth’s surface
(2) to the left of the direction of travel (4) downward toward Earth’s surface
7. ____ A weather instrument is shown below. Which weather variable is measured by this instrument?
(1) wind speed (2) precipitation (3) cloud cover (4) air pressure
8. ____ In the United States, most tornadoes are classified as intense
(1) low-pressure funnel clouds that spin clockwise
(2) low-pressure funnel clouds that spin counterclockwise
(3) high-pressure funnel clouds that spin clockwise
(4) high-pressure funnel clouds that spin counterclockwise
9. ____ Which type of air mass is associated with warm, dry atmospheric conditions?
(1) cP (2) cT (3) mP (4) mT
10. ____ What is the relative humidity if the dry-bulb temperature is 22°C and the wet-bulb temperature is 17°C?
(1) 5% (2) 14% (3) 60% (4) 68%
Base your answers to questions 51 through 53 on the weather map below. The weather map shows a low pressure system in New York State during July. The L represents the center of the low-pressure system. Two fronts extend from the center of the low. Line XY on the map is a reference line.
11. The cross section below shows a side view of the area along line XY on the map. On lines 1 and 2 in the cross section, place the appropriate two-letter air-mass symbols to identify the most likely type of air mass at each of these locations.
12. The forecast for one city located on the map is given below: “In the next hour, skies will become cloud covered. Heavy rains are expected with possible lightning and thunder. Temperatures will become much cooler.” State the name of the city for which this forecast was given.
13. Identify one action that people should take to protect themselves from lightning.
14. ____ Earth’s surface winds generally blow from regions of higher
(1) air temperature toward regions of lower air temperature (3) latitudes toward regions of lower latitudes
(2) air pressure toward regions of lower air pressure (4) elevations toward regions of lower elevations
Base your answers to questions 15 and 16 on the graph below, which shows air temperature, dewpoint, and present weather conditions for a 23-hour period at Dallas, Texas.
15. ____ The thunderstorm that occurred between 11 p.m. and 12 midnight was most likely the result of
(1) the arrival of a warm front (3) an increase in the difference between air temperature and dewpoint
(2) the arrival of a cold front (4) an increase in both air temperature and dewpoint
16. ____ Which weather condition was reported at Dallas when the air temperature was equal to the dewpoint?
(1) fog (2) rain (3) thunderstorm (4) drizzle
Base your answers to questions 17 through 19 on the information on the four station models shown below.
The weather data were collected at Niagara Falls, Syracuse, Utica, and New York City at the same time.
17. What was the air pressure in Niagara Falls?
18. Explain how the weather conditions shown on the station models suggest that Utica had the greatest chance of precipitation.
19. New York City was experiencing a wind blowing from the south at 10 knots with hazy conditions limiting visibility to 34 of a mile. On the station model for New York City below, place, in the proper location and format, the information below.
• wind direction
• wind speed
• present weather
• visibility
Base your answers to questions 20 and 21 on the barogram below, which shows air pressure recorded in millibars at Green Bay, Wisconsin, from April 2 through April 4, 1982.
20. Calculate the rate of change in air pressure from 10 a.m. to 8 p.m. on April 3. Label your answer with the correct units.
21. What most likely caused the changes in air pressure for the period of time shown on the graph?
22. ____ Which weather instrument is used to measure wind speed?
(1) anemometer (2) wind vane (3) psychrometer (4) thermometer
23. ____ A weather station model is shown to the right.
What is the barometric pressure indicated by this station model?
(1) 0.029 mb (3) 1002.9 mb
(2) 902.9 mb (4) 1029.0 mb
24. ____ What is the relative humidity when the dry-bulb temperature is 16°C and the wet-bulb temperature is 14°C?
(1) 90% (2) 80% (3) 14% (4) 13%
Base your answers to questions 25 through 29 on the weather map below. The isobars show air pressures, in millibars. Points A and B indicate locations on the map.
25. On the weather map to the right, place an X centered on the geographic region that was most likely the source of the mT air mass.
26. Calculate the pressure gradient along a straight line between point A and point B on the map. Label your answer with the correct units.
27. Describe the evidence shown on the map that indicates strong winds were blowing between Miles City and Pierre.
28. In the table below, write the names of the cities listed below in sequence from lowest relative humidity to highest relative humidity.
Albuquerque
Chicago
New York City
29. Describe the pattern of the surface winds around the center of the low-pressuresystem (L).
Regents Review: Meteorology 1-4 Created: March 2008