Chapter 5: Financial Forecasting 147
CHAPTER 5: FINANCIAL FORECASTING
Text Problem Solutions
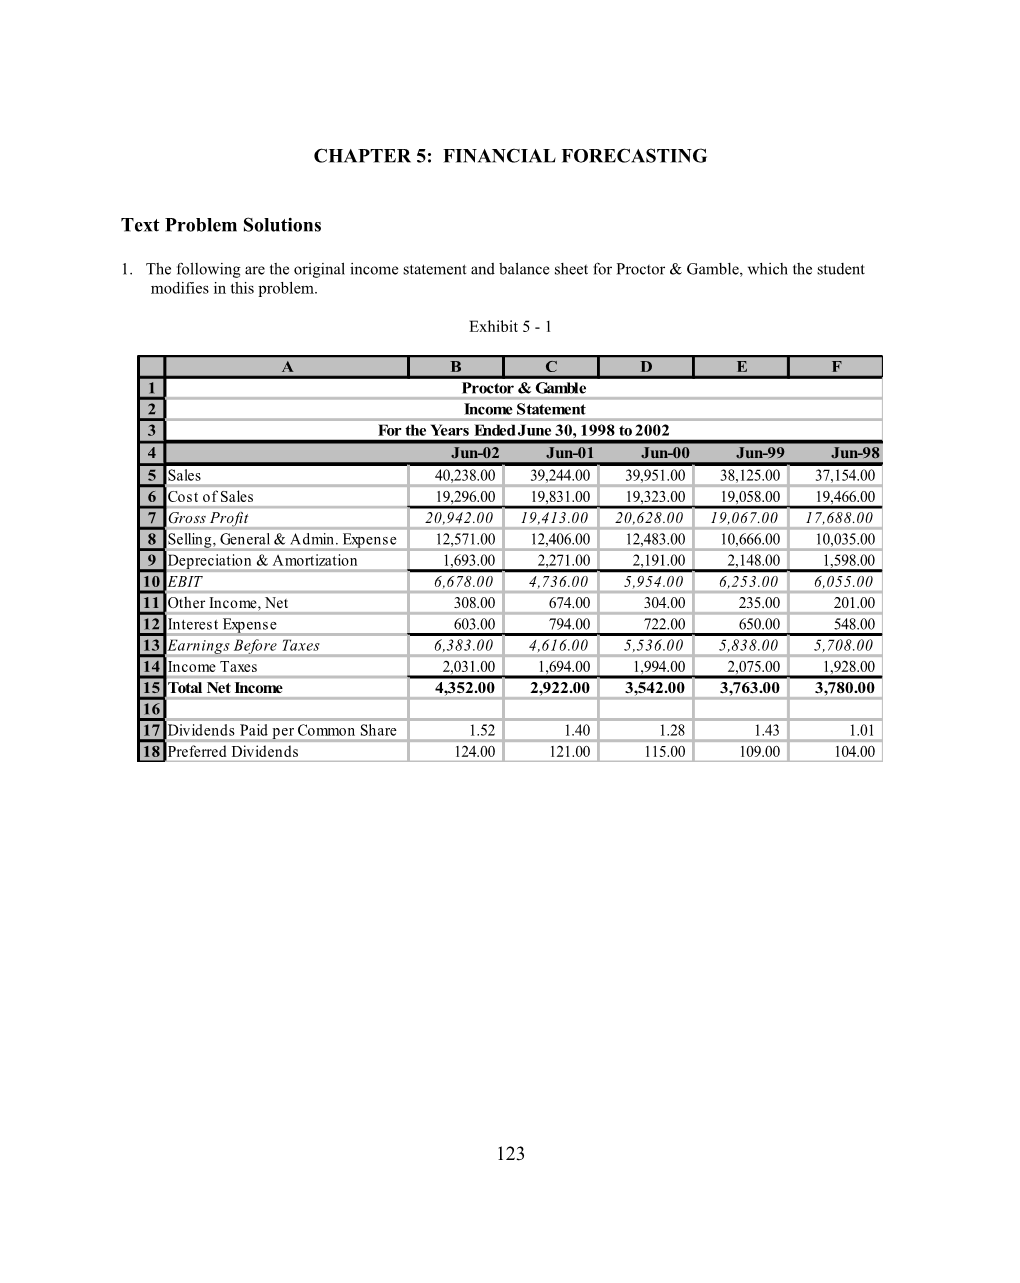
1. The following are the original income statement and balance sheet for Proctor & Gamble, which the student modifies in this problem.
Exhibit 5 - 1
Exhibit 5 - 2
a. The discretionary financing needed in 2003 is a surplus of $2,332.01.
Exhibit 5 - 3
Exhibit 5 - 4
Exhibit 5 - 5
Exhibit 5 - 6
Exhibit 5 - 7
Exhibit 5 - 8
b. There appears to be no discernable trend in this relationship since the slope of the trend line seems to be about zero.
Exhibit 5 - 9
c. The fact that there is no significant trend in the cash vs. sales chart can be demonstrated in the regression analysis by a very low R2, a very low F statistic and significance level, a very low t-statistic and high p-value for sales, and a 95% confidence interval that includes zero.
Exhibit 5 - 10
d. In each scenario the DFN is a surplus.
Exhibit 5 - 11
2. Using the Trend function to forecast depreciation expense, other income, and interest expense, the worksheet will appear as follows:
Exhibit 5 - 12
Exhibit 5 - 13
Exhibit 5 - 14
b. Using the Trend function with the balance sheet for cash, property plant and equipment (gross), intangibles and other non-current assets, the spreadsheet appears as follows:
Exhibit 5 - 15
Exhibit 5 - 16
Exhibit 5 - 17
Instructor’s Manual Problem Set
1. Using the Elvis Products International example from Chapter 5 in the text, increase the project Plant and Equipment balance in 2005 to $547,000. What happens to the funding requirement for 2005?
2. Using Betsen Boutique's financial statements from the Chapter 2 Problem Set, use the percent of sales method to develop pro forma statements for 2005. Sales for 2005 are projected to be $165,000. What are Betsen's funding requirements?
3. Calculate a forecasted 2002 sales and net income for Eli Lilly using the historical data below and compare it to the actual 2002 sales. Project these estimates using a four-, three- and two-year trend. Which of these trends seems to do a better job of forecasting the actual figures? Is the forecast for sales or net income closer to the actual? Why?
Exhibit 5 - 18
4. Run a regression using the Eli Lilly data. Is there a relationship between sales and net income, i.e. can net income be predicted from sales? What regression results support your finding? How reliable is a regression model based on five data points?
Internet Exercise
5. Obtain the income statement data for a company of your choice from the MoneyCentral Investor as described in the Chapter 5 Internet Exercise.
a. Forecast the latest year’s sales, cost of goods sold, and net income using a four-, three- and two-year trend. Which of the forecasts is most accurate when compared to the actual sales, COGS, and net income for that year? Why?
b. Run a regression using sales to predict COGS and another to predict net income. What are the regression equations for these models? Which is the better model and why?
Instructor’s Manual Problem Set Solutions
1. Changing Plant and Equipment in 2005 to $547,000 causes discretionary funding to change from a surplus to a deficit of $10,120. The student should notice that, in this situation, total assets have become larger than total liabilities and shareholder equity, causing the deficit.
Exhibit 5 - 19
Exhibit 5 - 20
Exhibit 5 - 21
Exhibit 5 - 22
Exhibit 5 - 23
2. The percent of sales forecast for Betsen results in $14,352 in net income and a surplus in discretionary financing of $2,440.
Exhibit 5 - 24
Exhibit 5 - 25
Exhibit 5 - 26
Exhibit 5 - 27
3. For the sales projection, the 2-year trend is closest to the actual, although all forecasts are reasonably close. As one would expect, none predict the downturn in sales. The net income projection has problems stemming from the fact that the historical data is not linear. It should be apparent to the student that projecting data into the future from historical information requires that the method of forecasting be matched to the shape of that prior data.
Exhibit 5 - 28
Exhibit 5 - 29
4. There is no significant relationship between Eli Lilly’s net income and sales. The low R square and F statistic, the insignificance of the X Variable, and the presence of zero within the range of the 95% confidence interval demonstrate this. It should be made clear to the student that this is an exercise in using Excel’s regression feature, but does not represent sound statistical analysis. Five data points is an extremely small sample.
Exhibit 5 - 30
5. McCormick & Company, Inc. is used to demonstrate this exercise.
a. The most accurate estimate varies with the data used. The 4-year trend in sales is the closest estimate of the actual sales for 2002. For the COGS all three trends do a reasonable job with the 2-year trend being the most accurate estimate of the actual 2002 COGS. All of the net income trends underestimate the actual 2002 net income slightly, but the 3-year trend is the highest. Sales, COGS and NI figures consistently increase over the projection period. One of the drawbacks of this method of trending is that it is linear and cannot deal well with turns in the data, as we see with McCormick’s sales in 2002. It should also be pointed out that McCormick’s net income in 2002 improved considerably over prior years and any method would have had difficulty correctly projecting this large of a change.
Exhibit 5 - 31
Exhibit 5 - 32
b. Based on the sample data, sales is a very good predictor of COGS for McCormick. The R square or explained variation is very high, .856; the F statistic and the X Variable are significant with a p-value of .02; and zero does not fall within the 95% confidence interval of the X variable. The regression equation for this model is: COGS = 461.027 + .382Sales.
Exhibit 5 - 33
Sales as a predictor of net income did not do as well. While the R square is a respectable .75, the F statistic and the t statistic are not significant at the 5% level normally considered acceptable in financial analysis. They are however just slightly above that at 5.77%. The model equation is: Net Income = -153.3 + .134Sales.
Exhibit 5 - 34