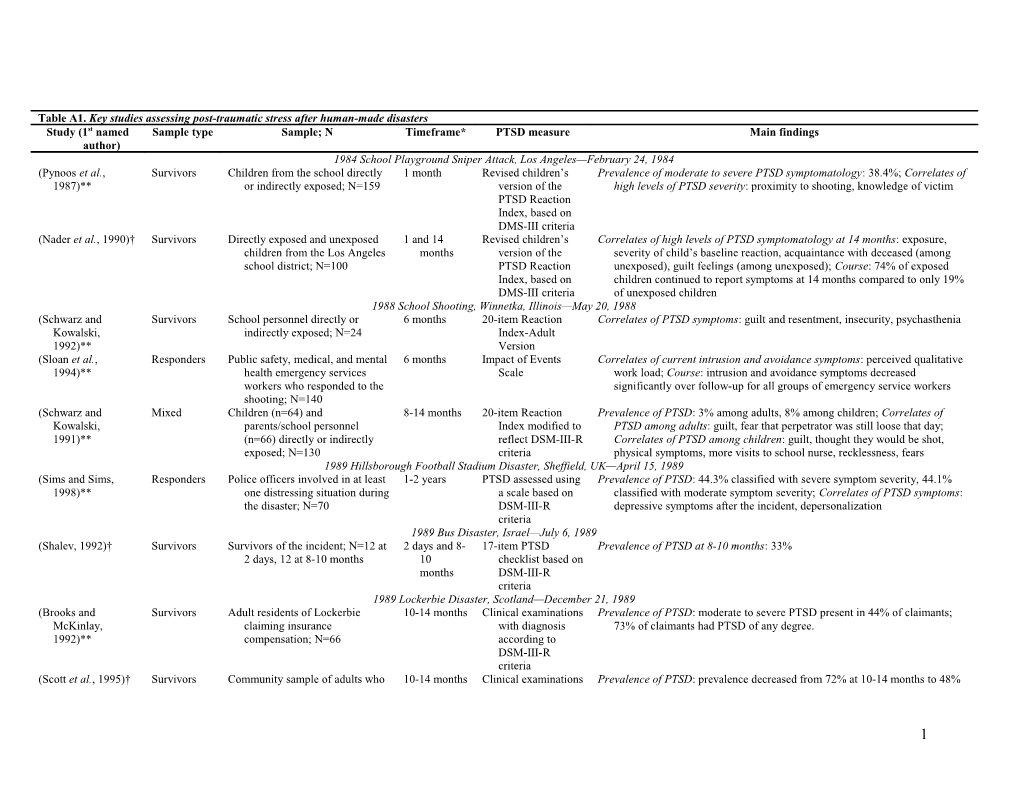
Study (1st named author)
/Sample type
/Sample; N
/ Timeframe* / PTSD measure / Main findings1984 School Playground Sniper Attack, Los Angeles—February 24, 1984
(Pynoos et al., 1987)** / Survivors / Children from the school directly or indirectly exposed; N=159 / 1 month / Revised children’s version of the PTSD Reaction Index, based on DMS-III criteria / Prevalence of moderate to severe PTSD symptomatology: 38.4%; Correlates of high levels of PTSD severity: proximity to shooting, knowledge of victim
(Nader et al., 1990)† / Survivors / Directly exposed and unexposed children from the Los Angeles school district; N=100 / 1 and 14 months / Revised children’s version of the PTSD Reaction Index, based on DMS-III criteria / Correlates of high levels of PTSD symptomatology at 14 months: exposure, severity of child’s baseline reaction, acquaintance with deceased (among unexposed), guilt feelings (among unexposed); Course: 74% of exposed children continued to report symptoms at 14 months compared to only 19% of unexposed children
1988 School Shooting, Winnetka, Illinois—May 20, 1988
(Schwarz and Kowalski, 1992)** / Survivors / School personnel directly or indirectly exposed; N=24 / 6 months / 20-item Reaction Index-Adult Version / Correlates of PTSD symptoms: guilt and resentment, insecurity, psychasthenia(Sloan et al., 1994)** / Responders / Public safety, medical, and mental health emergency services workers who responded to the shooting; N=140 / 6 months / Impact of Events Scale / Correlates of current intrusion and avoidance symptoms: perceived qualitative work load; Course: intrusion and avoidance symptoms decreased significantly over follow-up for all groups of emergency service workers
(Schwarz and Kowalski, 1991)** / Mixed / Children (n=64) and parents/school personnel (n=66) directly or indirectly exposed; N=130 / 8-14 months / 20-item Reaction Index modified to reflect DSM-III-R criteria / Prevalence of PTSD: 3% among adults, 8% among children; Correlates of PTSD among adults: guilt, fear that perpetrator was still loose that day; Correlates of PTSD among children: guilt, thought they would be shot, physical symptoms, more visits to school nurse, recklessness, fears
1989 Hillsborough Football Stadium Disaster, Sheffield, UK—April 15, 1989
(Sims and Sims, 1998)** / Responders / Police officers involved in at least one distressing situation during the disaster; N=70 / 1-2 years / PTSD assessed using a scale based on DSM-III-R criteria / Prevalence of PTSD: 44.3% classified with severe symptom severity, 44.1% classified with moderate symptom severity; Correlates of PTSD symptoms: depressive symptoms after the incident, depersonalization1989 Bus Disaster, Israel—July 6, 1989
(Shalev, 1992)† / Survivors / Survivors of the incident; N=12 at 2 days, 12 at 8-10 months / 2 days and 8-10 months / 17-item PTSD checklist based on DSM-III-R criteria / Prevalence of PTSD at 8-10 months: 33%1989 Lockerbie Disaster, Scotland—December 21, 1989
(Brooks and McKinlay, 1992)** / Survivors / Adult residents of Lockerbie claiming insurance compensation; N=66 / 10-14 months / Clinical examinations with diagnosis according to DSM-III-R criteria / Prevalence of PTSD: moderate to severe PTSD present in 44% of claimants; 73% of claimants had PTSD of any degree.(Scott et al., 1995)† / Survivors / Community sample of adults who claimed insurance compensation; N=25 / 10-14 months and 3 years / Clinical examinations with diagnosis according to DSM-III-R criteria / Prevalence of PTSD: prevalence decreased from 72% at 10-14 months to 48% at 3 years; Course: 28% remained free of PTSD throughout follow-up; 48% represented persistent cases; 24% of PTSD cases recovered
(Livingston et al., 1994)† / Survivors / Elderly residents of Lockerbie; N=31 at 1 year, 19 at follow-up / 1 and 3 years / Clinical examinations with diagnosis according to DSM-III-R criteria / Prevalence of PTSD: Prevalence decreased from 74% at 1 year to 16% at 3 years
1991 Mass Shooting Episode, Killeen, Texas—October 16, 1991
(North et al., 1994)** / Survivors / Persons directly or indirectly exposed to the shooting; N=113 / 1 month / Diagnostic Interview Schedule/Disaster Supplement, based on DSM-III-R criteria / Prevalence of PTSD: 28.6% in total sample (20.3% among men, 35.8% among women); Correlates of PTSD prevalence: any pre-disaster psychiatric disorder excluding PTSD (among women), post-disaster depression(North et al., 1997)† / Survivors / Persons directly or indirectly exposed to the shooting; N=136 at 6-8 weeks, 124 at 13-14 weeks / 6-8 weeks and 13-14 months / Diagnostic Interview Schedule/Disaster Supplement, based on DSM-III-R criteria / Onset: 68% reported symptom onset the day of the incident, 22% the week after, and 11% later in the month; Correlates of PTSD prevalence: female gender, pre-disaster psychopathology (among women), pre-disaster depression, acute post-disaster psychiatric illness or depression; Course of current PTSD: prevalence decreased from 27.2% at 6-8 weeks to 17.7% at 13-14 months
(North et al., 2001)† / Survivors / Persons directly or indirectly exposed to the shooting; N=136 at 6-8 weeks, 124 at 13-14 weeks, 116 at 3 years / 6-8 weeks, 13-14 months, and 3 years / Diagnostic Interview Schedule/Disaster Supplement, based on DSM-III-R criteria / Correlates of PTSD prevalence: abandonment of control (at 6-8 weeks, 13-14 months, and 3 years), passive isolation (at 6-8 weeks); Course of current PTSD: 29% at 6-8 weeks, 17% at 13-14 months, 19% at 3 years
(North et al., 2002a)† / Survivors /
Adults directly or indirectly exposed to the shooting; N=136 at 6-8 weeks, 116 at 3 years
/ 6-8 weeks, 13-14 months, and 3 years / Diagnostic Interview Schedule/Disaster Supplement, based on DSM-III-R criteria / Correlates of chronic PTSD at 3 years post-disaster: functional impairment, seeking mental health treatment at baseline; Course of current disaster-related PTSD: 26% at 6-8 weeks, 14% at 1 year, 18% at 3 years1992 Los AngelesCounty Civil Disturbances—April 29, 1992
(Hanson et al., 1995)** / Community / Household probability sample of adults from L.A.County; N=1200 / 6-8 months / National Women’s Study PTSD Module, based on DSM-III-R criteria / Prevalence of current (past 6 months) PTSD: 4.1%; Correlates of PTSD prevalence: lifetime traumatic events (OR = 1.50), past year stressful events (OR = 1.44), past year victimization (OR = 2.02), disturbance exposure (OR = 1.26)1992 Courthouse Shooting, Missouri—May 5, 1992
(Johnson et al., 2002)† / Survivors / Courthouse employees and offices of exposed individuals; N=80 at 6-8 weeks, 77 at 1 and 3 years / 6-8 weeks; 1 and 3 years / Diagnostic Interview Schedule/Disaster Supplement / Prevalence of disaster related PTSD: 5%; Onset: 6 of 8 cases reported symptom onset on the day of the incident; Correlates of PTSD symptoms at 6-8 weeks: older age, less than a college education, currently married; Course: 6 of 8 cases of PTSD were resolved by 3 years; symptoms decreased significantly between baseline and follow-up1993 WorldTradeCenter Bombing—February 26, 1993
(Koplewicz et al., 2002)† / Survivors / Exposed public school students at the WorldTradeCenter during the explosion (N=22) and 27 unexposed controls; N=49 / 3 and 9 months / Posttraumatic Stress Reaction Index / Correlates of PTSD symptoms: being in exposed group; Course: prevalence of severe to very severe symptomatology among exposed children decreased from 27% at 3 months to 14% at 9 months1993 Fire at the Branch Davidian Compound, Waco, Texas—April 19, 1993
(McCarroll et al., 1996)** / Responders / Exposed dentists (n=31) who performed postmortem identifications and unexposed control dentists (n=47); N=78 / 6 months / Impact of Events Scale / Correlates of PTSD symptoms: being in exposed group, duration of exposure to remains, younger age (among exposed), spouse and co-worker support (among exposed)1993 Sivas Religious Uprisings, Turkey—July 2, 1993
(Sungur and Kaya, 2001)† / Mixed / Highly exposed fire survivors (n=27), moderately exposed violent protest survivors (n=34), and mildly exposed health professionals (n=18); N=79 / 1, 6, 12, and 18 months / PTSD defined according to DSM-III-R criteria / Prevalence of acute PTSD: 20.3%; Prevalence of chronic PTSD: 12.7%, of which 1.3% resolved by 18 months and 11.4% persisted; Prevalence of delayed-onset PTSD: 16.5%, of which 11.5% were resolved by 18 months and 5.0% persisted; Correlates of chronic PTSD: extent of trauma1994 Church Explosion, Lebanon—February 27, 1994
(Farhood and Noureddine, 2003)** / Survivors / Victims of the explosion (n=33), adults from victims’ families (n=30), and matched neighbors (n=30); N=93 / 15 months / Clinician Administered PTSD Scale Version I / Prevalence of PTSD: 39.4% among victims, 10% among family members, 0% among neighbors; Predictors of PTSD prevalence among victims: female gender, severe injury, financial problems1994 BrooklynBridge Shooting—March 1, 1994
(Trappler and Friedman, 1996)† / Survivors / Hasidic students (ages 16-22) who survived a shooting attack on their van; N=11 / 8 weeks and 10 months / Posttraumatic Stress Disorder Symptom Scale, based on DSM-IV criteria / Prevalence of PTSD: 4 of 11 students (28%) had PTSD at 8 weeks; Course: At 10 months, all 4 students with PTSD at 8 weeks showed persistent symptoms of PTSD1995 Oklahoma City Bombing—April 19, 1995
(Pfefferbaum et al., 1999)** / Community / Oklahoma City public school students; N=3218 / 7 weeks / Impact of Events Scale-Revised / Correlates of higher PTSD symptom scores: higher proportion of bombing-related television viewing in month after attack, reporting a sibling or parent killed, female gender(Pfefferbaum et al., 2001)** / Community / Students from 11 public middle schools in Oklahoma City; N=2381 / 7 weeks / 22 items adapted from the Impact of Events Scale-Revised / Correlates of higher PTSD symptoms scores: television exposure (among students with no physical or emotional exposure)
(Pfefferbaum et al., 2002a)** / Community / Students from 11 public middle schools in Oklahoma City; N=2381 / 7 weeks / 22 items adapted from the Impact of Events Scale-Revised / Correlates of higher PTSD symptoms scores: television exposure, peritraumatic response
(Smith et al., 1999)** / Community / Exposed adults from Oklahoma City (n=1010) and unexposed controls from Indianapolis (n=750); N=1760 / 3-4 months / 6 questions about PTSD symptoms / Prevalence of PTSD symptoms: in Oklahoma City, 76.1% reported at least one PTSD symptom (compared to 62.7% in Indianapolis) and 43.1% reported at least 4 PTSD symptoms (compared to 32.1% in Indianapolis)
(Trautman et al., 2002)** / Community / Adult Asian and Middle Eastern immigrants living in Oklahoma City; N=45 / 1.5-2 years / 21 Items from the Posttraumatic Stress Scale / Correlates of PTSD symptoms: PTSD symptoms from prior trauma, older current age, younger age at time of prior trauma
(Pfefferbaum et al., 2000b)** / Community / Sixth grade public school students from a community 100 miles from Oklahoma City; N=69 / 2 years / 22 items adapted from the Impact of Events Scale-Revised / Prevalence of PTSD: 44% using least stringent criteria, 4% using most stringent criteria; Correlates of PTSD symptoms: difficulty functioning, exposure to TV/radio coverage of bombing (current and in aftermath), proportion of reading devoted to bombing-related material (current and in aftermath), having a friend who knew someone injured or killed
(North et al., 1999)† / Survivors / Adults survivors of the bombing selected from a registry; N=182 at 6 months, 141 at 1 year / 6 months and 1 year / Diagnostic Interview Schedule/Disaster Supplement, based on DSM-III-R criteria / Prevalence of PTSD at 6 months: 34.3%; Onset: Among PTSD cases, 74% reported same day onset, 18% within the first week, and 4% within the first month; Correlates of PTSD prevalence at baseline: female gender, pre-disaster psychiatric disorder, injury, injury or death of family member or friend; Course: 89% of persons with PTSD since the bombing were still symptomatic at 6 months
(North et al., 2004)† / Survivors / Survivors in the direct path of the explosion; N=137 / 6 and 17 months / Diagnostic Interview Schedule/Disaster Supplement for DSM-III-R / Course: prevalence of bombing-related PTSD was 32% at 6 months and 31% at 17 months
(Shariat et al., 1999)** / Survivors / Adult survivors of the bombing; N=494 / 1.5-3 years / PTSD measured using DSM-IV criteria / Prevalence of PTSD: 4%
(North et al., 2002b)** / Responders / Firefighters involved in rescue and recovery; N=181 / 34 months / Diagnostic Interview Schedule for DSM-III-R / Correlates of PTSD prevalence: functional impairment, less pride in job, less positive job satisfaction, reporting more negative effects of the bombing on job satisfaction, less likely to get along with their boss and coworkers, changes in relationships
(Tucker et al., 2000)** / Mixed / Adults from Oklahoma City seeking mental health assistance; N=85 / 6 months / Impact of Events Scale-Revised / Correlates of PTSD symptoms: being injured, feeling nervous or afraid, perceived life endangerment, being upset by others’ behaviors, reporting that counseling helped, reporting that work helped
(Pfefferbaum et al., 2000a)** / Mixed / Exposed children who reported the death of a friend or acquaintance (n=27) and unexposed matched children (n=27); N=54 / 8-10 months / 22 items adapted from the Impact of Events Scale-Revised / The mean PTSD symptom score for the group that lost a friend was significantly higher than for the group that lost an acquaintance; however, neither the group who lost a friend nor the group who lost an acquaintance scored significantly higher than the unexposed group
(North et al., 2002c)** / Mixed / Firefighters involved in rescue and recovery (n=181) and primary victims (n=88); N=269 / 34 months / Diagnostic Interview Schedule / Prevalence of PTSD: prevalence among firefighters was lower than among primary victims (13% vs. 23%); Correlates of PTSD prevalence among firefighters: time spent at the bombing site, time spent in “the pit”, pre-disaster PTSD diagnosis
(Pfefferbaum et al., 2002b)** / Mixed / Female partners of firefighters who participated in rescue effort; N=27 / 42-44 months / Diagnostic Interview Schedule for DSM-III-R / Prevalence of bombing-related PTSD: 4% (1/27); Correlates of PTSD symptoms: change in job satisfaction for the worse (hyperarousal symptoms only)
(Pfefferbaum et al., 2006b)** / Mixed / Female partners of firefighters who participated in recovery effort; N=24 / 43-44 months / Diagnostic Interview Schedule for DSM-III-R / Prevalence of bombing-related PTSD: 4% (1/24)
1995 Elementary School Hostage Situation, Paris, France—December 3, 1995
(Vila et al., 1999)† / Survivors / Directly (taken hostage) and indirectly exposed children (ages 6-10); N=47 / 2, 4, 7, and 18 months / Diagnoses using Kiddie-SADS-L according to DSM-IV criteria / Course of PTSD among exposed: 4% at 4 months, 12% at 7 months, 5% at 18 months; Course of PTSD among indirectly exposed: 10% at 4 months, 6% at 7 months, 0% at 18 months
1996 Subway Bombing, Paris, France—December 1996
(Jehel et al., 2003)† / Survivors / Victims of the bomb attack; N=32 / 6 and 32 months / Questionnaire of Posttraumatic Stress and the Impact of Events Scale; caseness based on DSM-III-R criteria / Correlates of higher PTSD symptoms at 32 months: physical injuries, non-managerial employment position, psychometric drug use before the incident; Course of current PTSD: prevalence decreased from 39% at 6 months to 25% at 32 months1998 American Embassy Bombing, Nairobi, Kenya—August 7, 1998
(Pfefferbaum et al., 2003)** / Survivors / Nairobi school children exposed to the bombing; N=562 / 8-14 months / 22-item Posttraumatic Stress Scale / Correlates of PTSD symptoms: more severe peri-traumatic reaction, PTSD symptoms relating to other prior traumatic experiences(Njenga et al., 2004)** / Mixed / Opportunistic sample of patients from mental health clinic, employees in nearby office buildings, people who visited mental health information stations; N=2627 / 1-3 months / 21 yes/no questions that matched most of the DSM-IV criteria / Prevalence of PTSD: 35.4%; Correlates of PTSD prevalence: female gender, unmarried status, less education, location somewhere outside of a building, seeing the blast, injury of any kind, not being cured (among injured), feeling afraid, feeling helpless, feeling threatened, not confiding in a friend, bereavement, experiencing financial difficulties
1998 Omagh Bombing, Northern Ireland—August 15, 1998
(Luce and Firth-Cozens, 2002)† / Responders / Doctors working in the aftermath of the bombing; N=17 at 4 and 17 months / 4 and 17 months / PTSD Symptom Scale, based on DSM-IV criteria / Correlates of PTSD symptoms: younger age; Course: prevalence of PTSD among doctors increased from 6% at 4 months to 12% at 17 months(Luce et al., 2002)** / Mixed / Employees of the local health service, approximately half having professional or civilian involvement; N=1064 / 4 months / Posttraumatic Stress Disorder Symptom Scale, based on DSM-III-R criteria / Correlates of PTSD symptoms: involvement in the bombing, involvement in both a civilian and professional capacity, previous experiences of trauma, past emotional difficulties
1998 Discotheque Fire, Goteborg, Sweden—0ctober 29, 1998
(Dyregrov et al., 2003)** / Community / Students aged 13 to 19 years from throughout Goteborg; N=563 / 7 months / Impact of Events Scale, using cutoff of 35 / Prevalence of PTSD: 27% (33% among males, 22% among females); Correlates of higher PTSD symptom scores: female gender, being born outside Sweden, present at discotheque when fire started, greater closeness to victims(Broberg et al., 2005)** / Survivors / Adolescents aged 13 to 24 who survived the fire; N=275 / 18 months / Clinician Administered PTSD Scale, based on DSM-IV criteria / Prevalence of PTSD: 25% (19% among girls born in Sweden, 26% among girls not born in Sweden, 17 among boys born in Sweden, 31% among boys not born in Sweden); Correlates of higher PTSD symptom scores: less satisfaction with how school handled disaster, more absences related to the fire
September 11, 2001 Terrorist Attacks, New York City and Washington, DC—September 11, 2001
(Lengua et al., 2005)† / Community / Children and their parents enrolled in ongoing cohort study of child development; N=142 / Prior to attacks, 1 month, and 6 months / Child PTSD Symptom Scale, based on DSM-IV criteria / Prevalence of PTSD at 1 month: 8% (15% excluding functional impairment); Correlates of PTSD prevalence at 1 month: African-American race/ethnicity, pre-attack depression (child report), pre-attack externalizing (mother report), pre-attack social competence (child report), pre-attack self-esteem (mother report)(Murphy et al., 2003)** / Community / African-American undergraduates; N=219 / 2-3 days / Modified version of the PTSD Checklist-Civilian Version; caseness required scoring at least 50 out of 85 / Prevalence of PTSD: 5%; Correlates of PTSD symptoms: having parents not currently together, later college year
(Schuster et al., 2001)* / Community / Nationally representative sample; N=560 adults, 170 children / 3-5 days / For adults, 5 items from the PTSD checklist; for children, 5 items from the Diagnostic Interview Schedule for Children, Version 4 / Prevalence of substantial stress reaction: 44% among adults, 35% among children; Correlates of PTSD symptoms among adults: female gender, minority status, prior emotional or mental health problems, proximity to World Trade Center, northeast region residence, more hours of TV coverage viewed on day of attacks; Correlates of PTSD symptoms among children: female gender
(Galea et al., 2002)** / Community / Random sample of Manhattan adults living south of 110th street; N=988 / 5-8 weeks / National Women’s Study PTSD questionnaire / Prevalence of PTSD: 7.5%; Correlates of PTSD prevalence: Hispanic ethnicity (OR = 2.6), experiencing ≥2 stressors in the 12 months before Sept. 11 (OR = 5.5), panic attack (OR = 7.6), residence south of Canal St. (OR = 2.9), loss of possessions due to the attacks (OR = 5.6)
(Pulcino et al., 2003)** / Community / Random sample of Manhattan adults living south of 110th street; N=988 / 5-8 weeks / National Women’s Study PTSD questionnaire / Correlates of PTSD prevalence: after adjusting for potential confounders, the association between female gender and PTSD diminished from OR = 2.2 to OR = 1.2
(Ahern et al., 2002)** / Community / Manhattan adults living south of 110th street; N=988 / 5-8 weeks / National Women’s Study PTSD questionnaire / Correlates of PTSD prevalence: reporting seeing people falling from the WorldTradeCenter more than 7 times on television (OR = 3.1)
(Schlenger et al., 2002)** / Community / Nationally representative adult sample with oversample of several metropolitan areas; N=2273 / 1-2 months / Specific stressor version of PTSD Checklist; caseness required scoring ≥50 / Prevalence of PTSD: 11.2% among NYC residents, 4.3% nationally; Correlates of PTSD prevalence: being in NYC metro area on Sept. 11, TV coverage viewed per day, graphic Sept. 11 events viewed on TV; Correlates of PTSD symptoms (NYC sample only): younger age, female gender, being in the WTC on Sept. 11, hours of TV coverage viewed per day