Name ______Period______Date______
Constructing Two-Way Tables(page 1)
A two-way table organizes categorical data from one sample group as it relates to two different categories.
Example: A survey is taken of 500 students. They were asked whether or not they were on the honor roll and whether or not they played a sport. 115 students responded “on the honor roll only”; 55 students said they played a sport only; 250 students played a sport and are on the honor roll.
Step 1 This information can be organized into a table:
Play a Sport / Do Not Play a SportOn the Honor Roll / 250 / 115
Not on the Honor Roll / 55
Play a Sport / Do Not Play a Sport / Total
On the Honor Roll / 250 / 115 / 365
Not on the Honor Roll / 55 / 80 / 135
Total / 305 / 195 / 500
Step 2 We can add columns for total and fill in the missing information:
Tacos / No Tacos / TotalHamburgers / 19 / 17 / 36
No hamburgers / 21 / 3 / 24
Total / 40 / 20 / 60
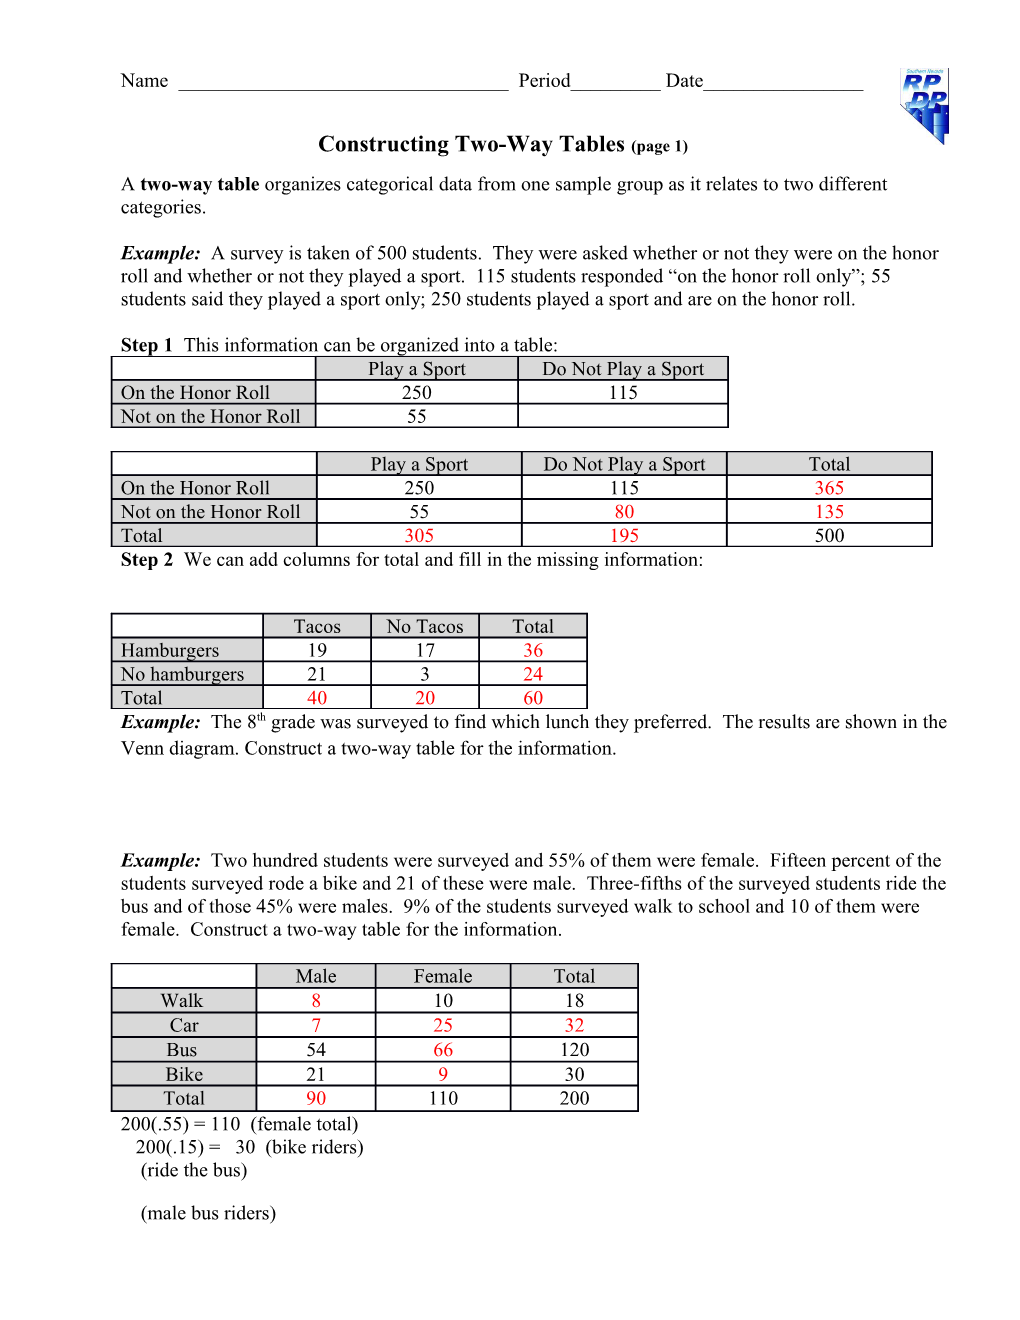
Example: The 8th grade was surveyed to find which lunch they preferred. The results are shown in the Venn diagram. Construct a two-way table for the information.
Example: Two hundred students were surveyed and 55% of them were female. Fifteen percent of the students surveyed rode a bike and 21 of these were male. Three-fifths of the surveyedstudents ride the bus and of those 45% were males. 9% of the students surveyed walk to school and 10 of them were female. Construct a two-way table for the information.
Male / Female / TotalWalk / 8 / 10 / 18
Car / 7 / 25 / 32
Bus / 54 / 66 / 120
Bike / 21 / 9 / 30
Total / 90 / 110 / 200
200(.55) = 110 (female total)
200(.15) = 30 (bike riders)
(ride the bus)
(male bus riders)
(.09)(200) = 18 (walk to school)
Constructing Two-Way Tables (page 2)
- Data from 100 flights were collected. The flights were categorized as domestic or international and late or not late. Of the domestic flights, 20 were late, and 60 were not late. Five of the international flights were late. Construct a two-way table for the information.
- 150 people who attended a UNLV basketball game were surveyed. 20 people surveyed ate hot dogs. Of those, 10% were adults. Forty percentof all surveyed ate pizza. Of those who ate pizza, 25% were children. Thirty adults said they ate hamburgers. Construct a two-way table for the information.
- A survey was conducted with a volleyball team to determine the color of their uniforms. The results are shown in the Venn diagram. Construct a two-way table for the information.
Total
France / Germany / Italy / Total
Female / 95
Male / 90
Total / 50 / 200
- 200 Spanish students each visited one foreign country last week. Fifteen percent of the students visited Italy. Half of these students were female.Complete the two-way table including this information.